Bell's Theorem
Introduction
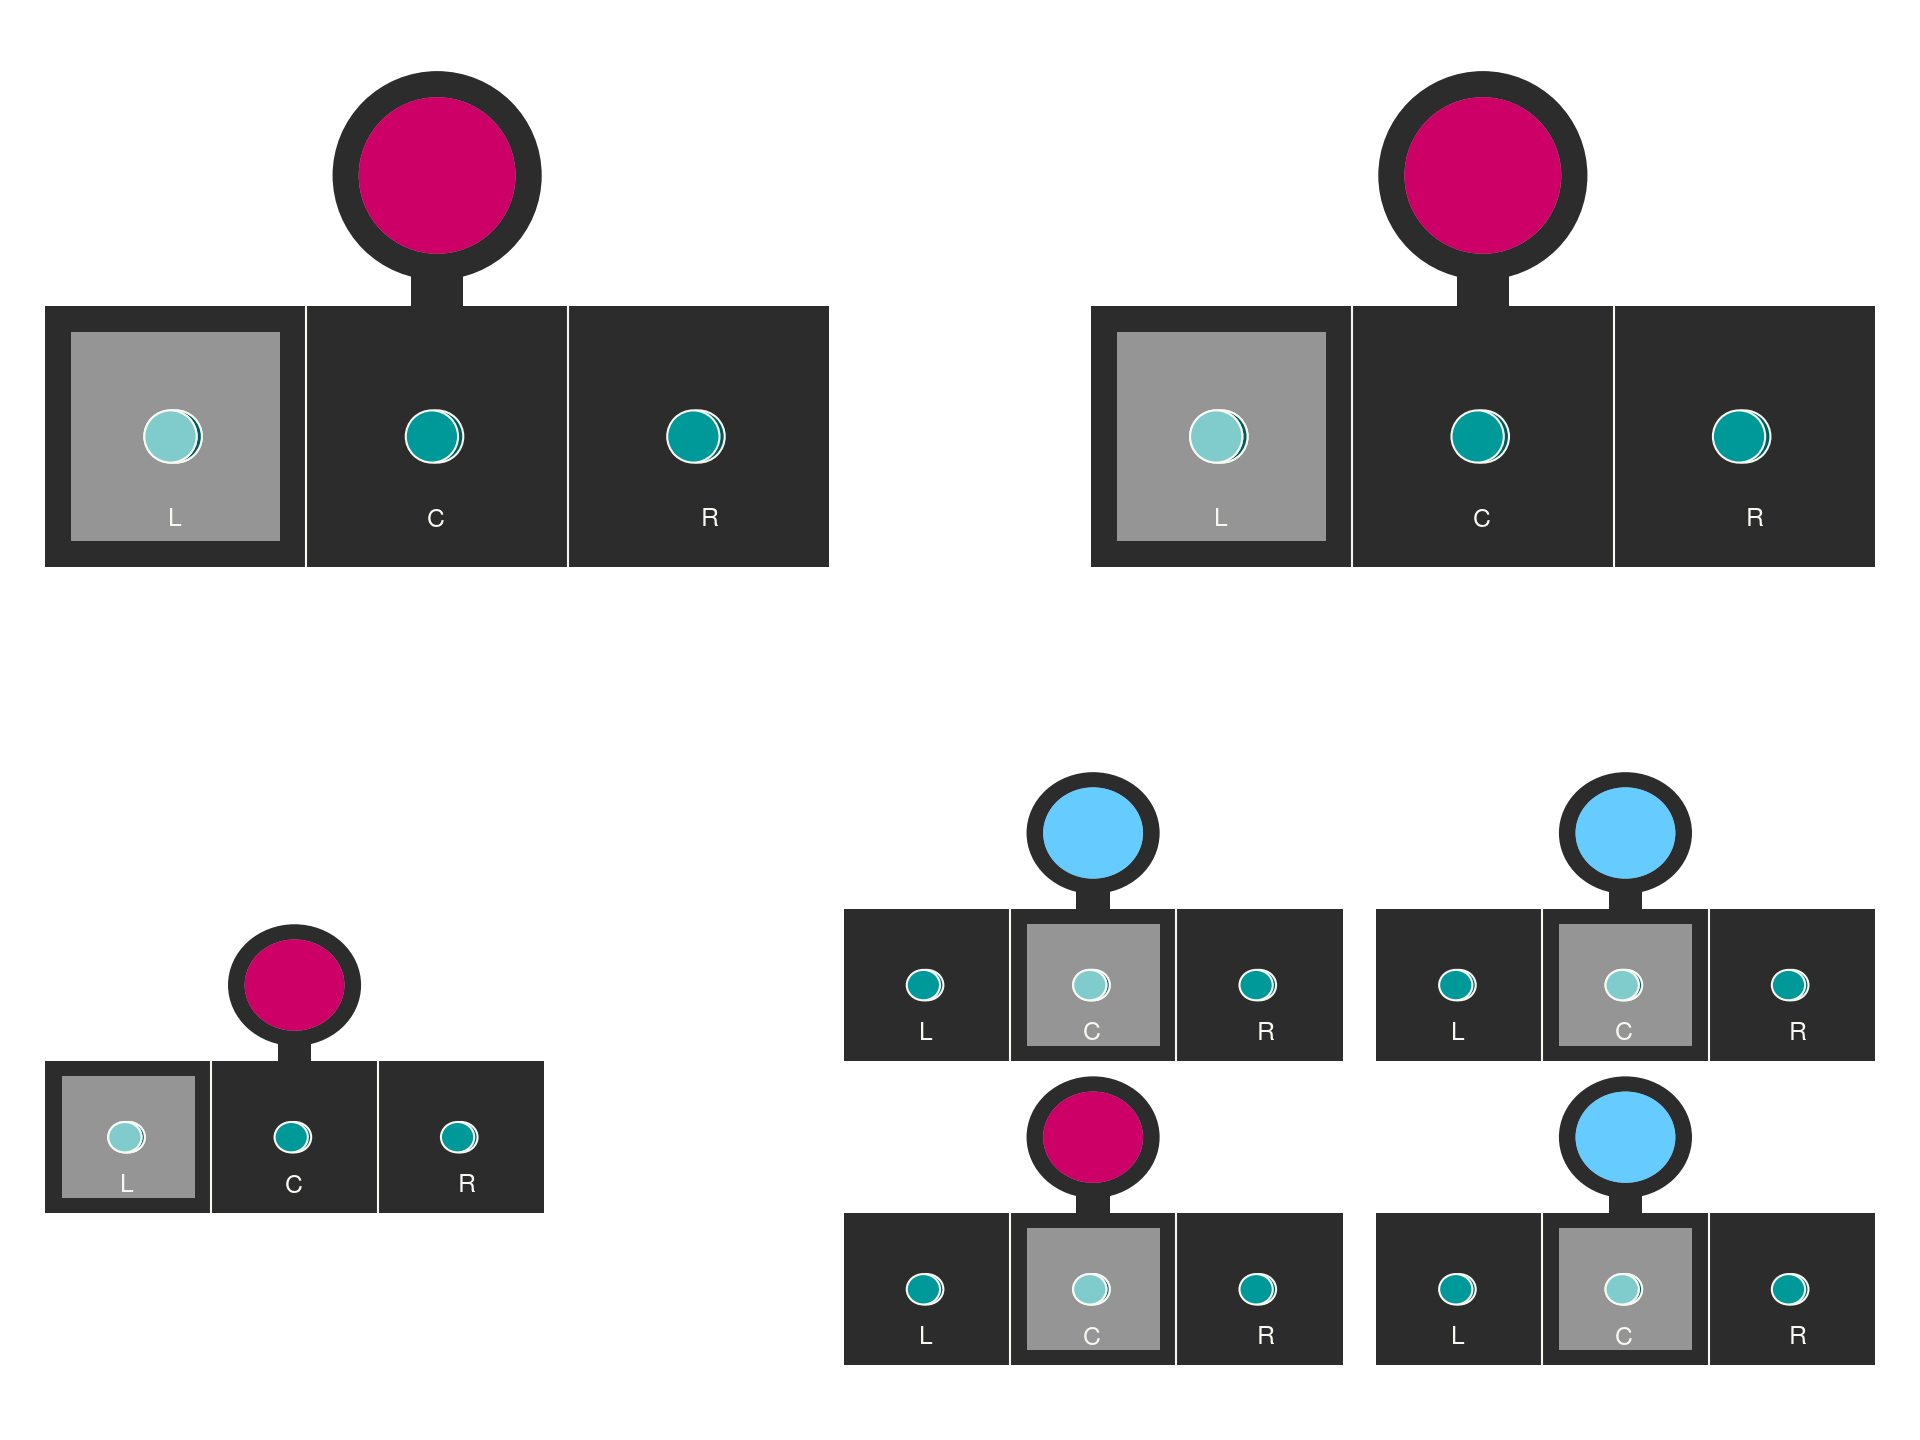
Apparatus
Following our theoretical discussion here, we will now describe a practical experimental apparatus designed to test predictions and observe phenomena related to quantum mechanics.
The experimental apparatus is composed of three distinct units. Two units serve as detectors and are positioned at a considerable distance from one another, each detector is equipped with a switch that can be set to one of three positions, allowing for varied experimental conditions (that is analogous to our buttons).
Upon detecting a particle, these units respond by illuminating a light: red or blue, depending on the particle’s spin orientation as it interacts with the magnetic field within the detector.
The third component is located midway between detectors functions as the source. This placement is crucial for ensuring that the particles emitted have equal probability of being detected by the other two units, facilitating the examination of entanglement and quantum correlation effects between the particles.
Experimental results
The experimental demonstration is conducted as follows: each detector’s switch is independently and randomly adjusted to one of three possible positions pushing a button. Subsequently, the source unit is activated, initiating the emission of particles. Shortly thereafter, each detector responds by displaying either a red or a blue light, depending on the detected spin state.
The configuration of the switches at the time of particle detection, along with the corresponding colors displayed by the detectors, are recorded. This process is repeated multiple times to gather a substantial data set.
Each trial, or “run”, of the experiment generates specific data, consisting of the switch positions and the colors flashed by the detectors. For instance, if in a particular run, the first detector was set to box L, the second detector to box C, the first detector flashed red, the second detector flashed blue, the data from this run would be recorded as LCRB. This systematic recording allows for detailed analysis of correlations and statistical patterns in the outcomes.
From a comprehensive set of experimental runs, two key observations emerge regarding the behavior of the detectors:
-
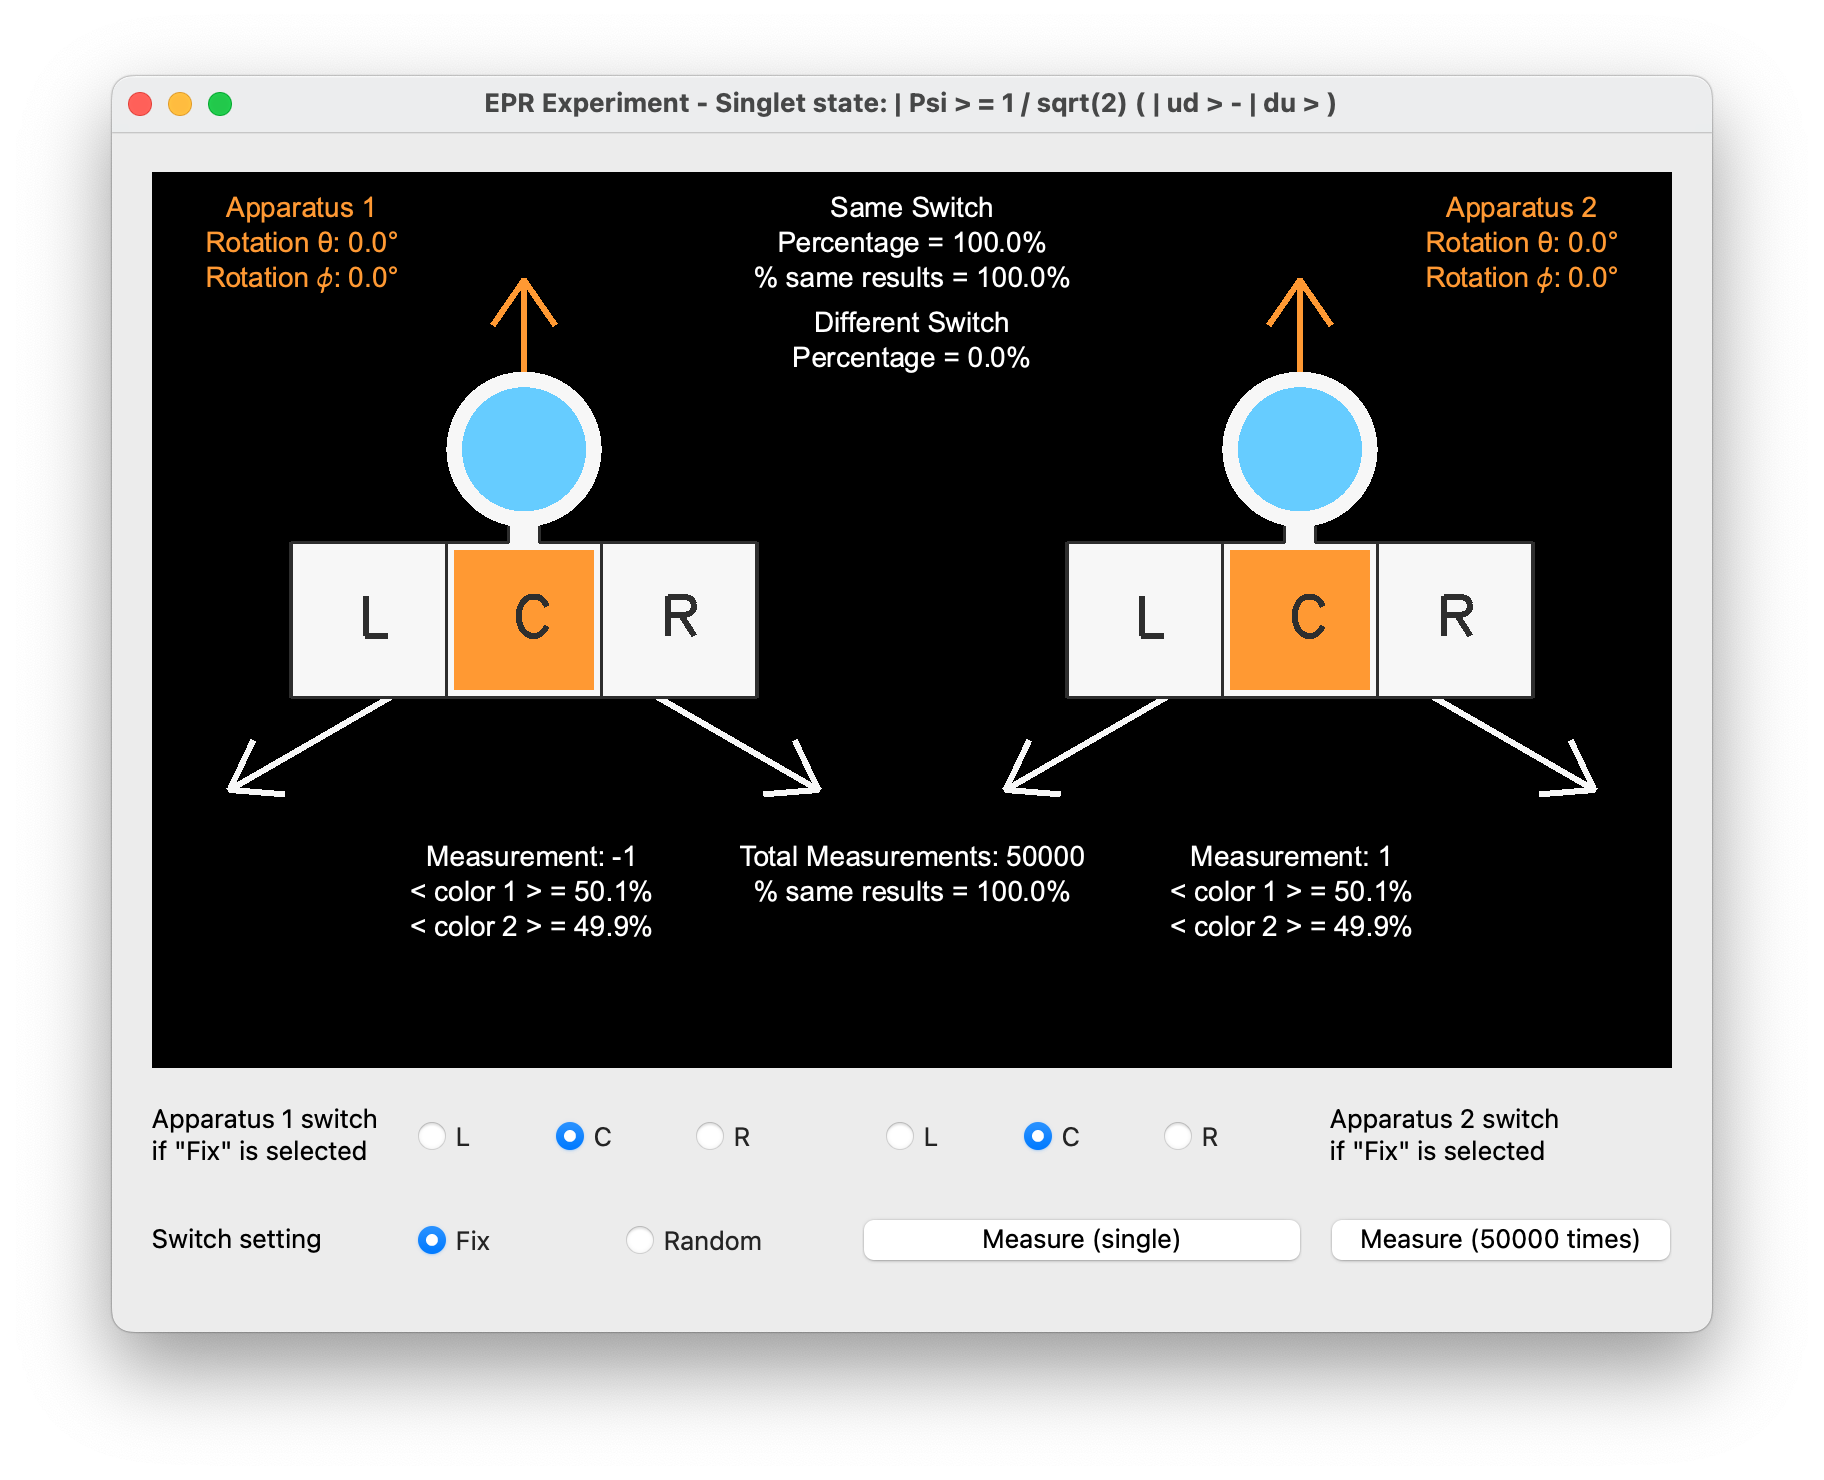
Consistency in identical settings: When analyzing only those runs where the switches on both detectors are set to the same box, it is observed that the detectors invariably flash the same color. This indicates a strong correlation in detector responses under uniform conditions.
-
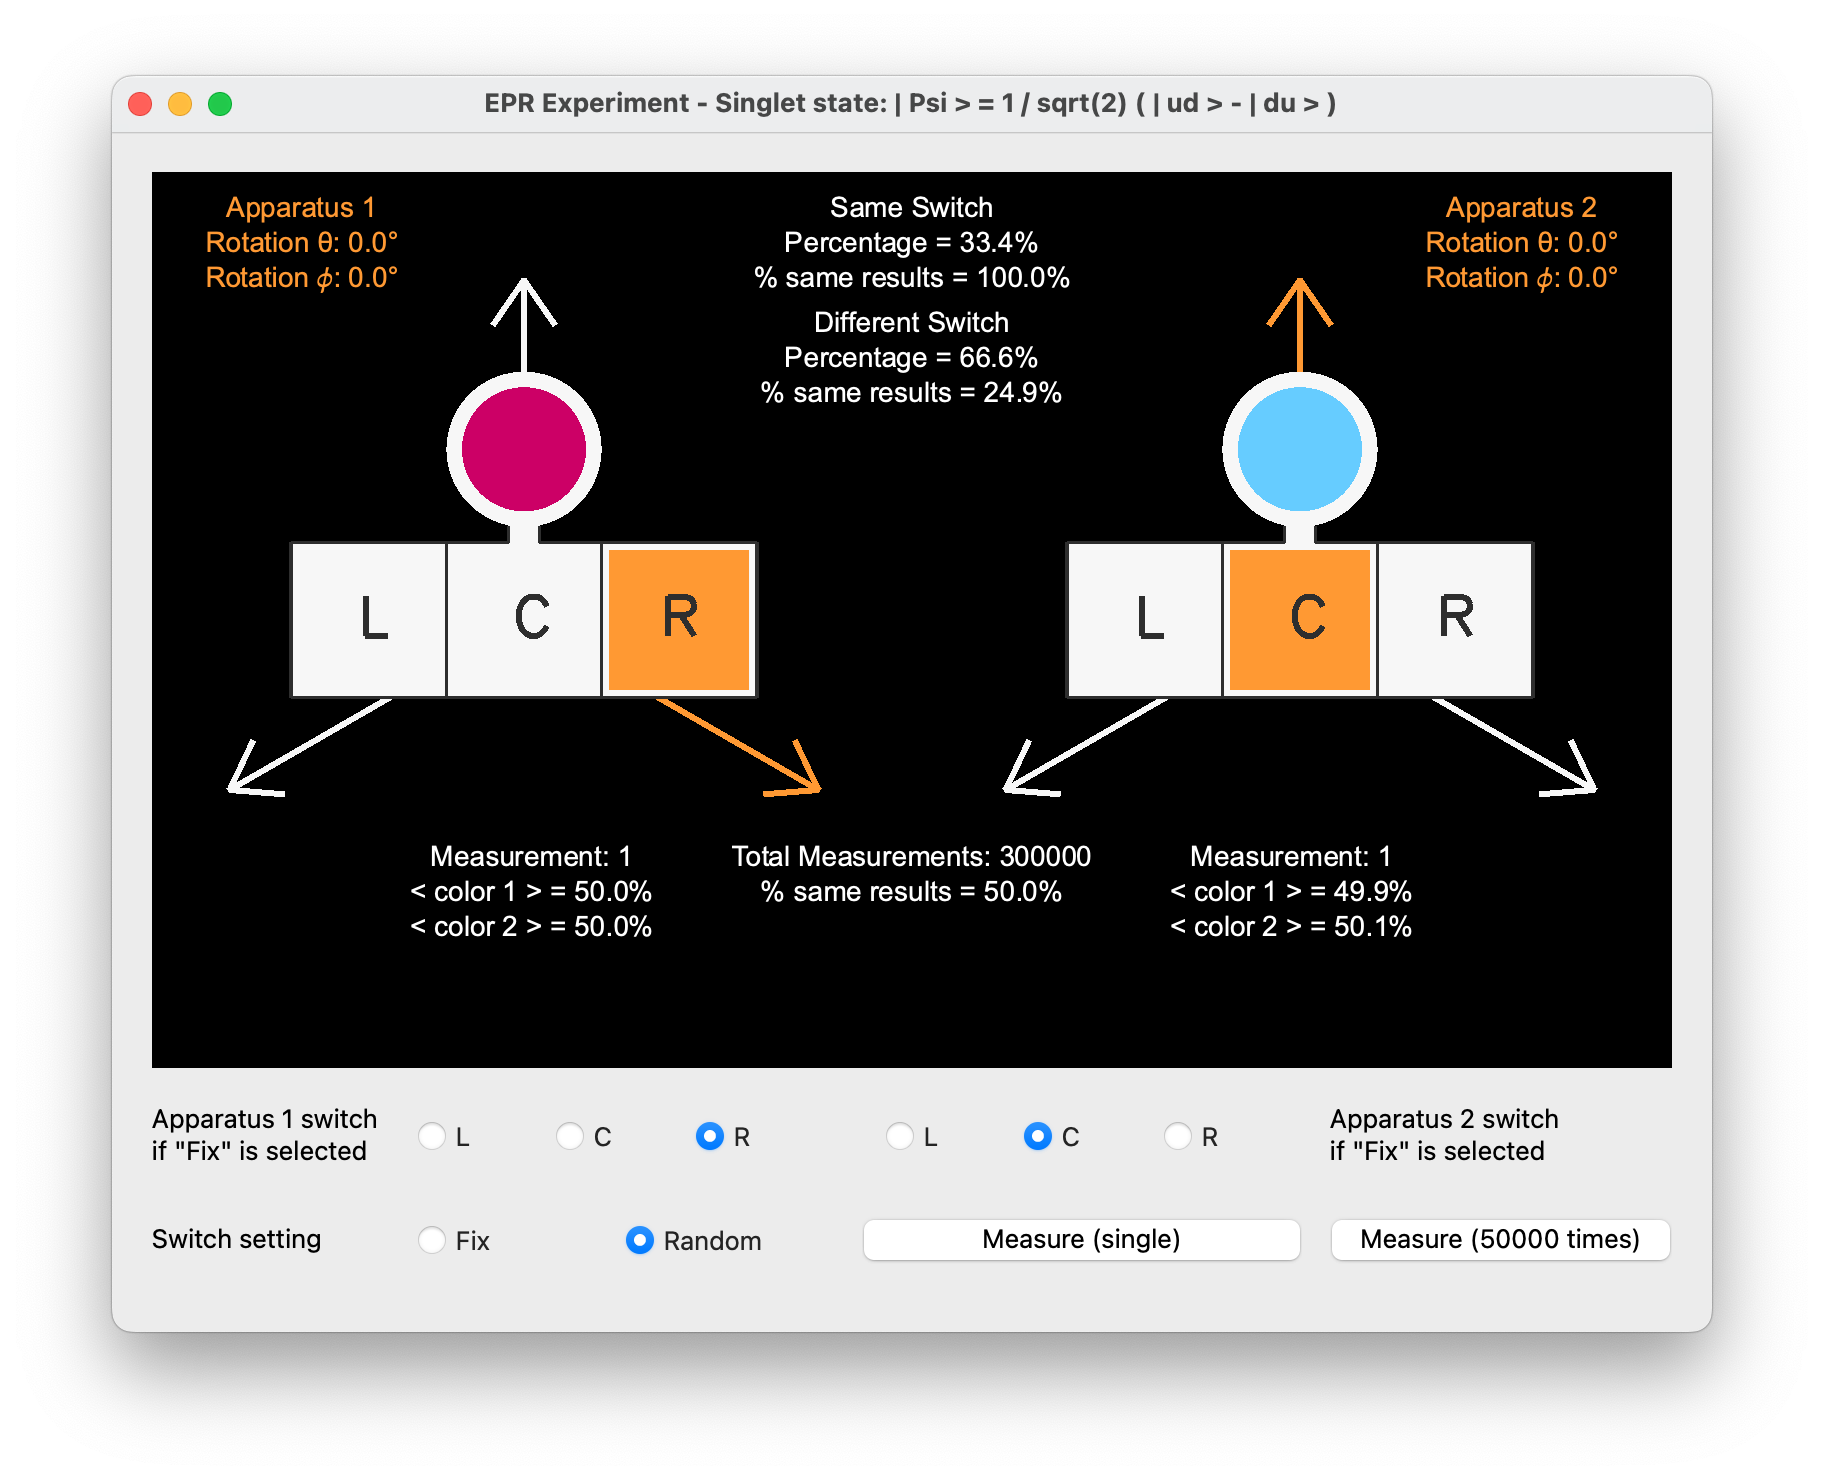
Randomness in varied settings: Upon examining the entirety of the runs without consideration for the switch settings, the pattern of the lights flashing appears entirely random. Specifically, in these unfiltered runs, the lights flash the same colors 50% of the time and different colors 50% of the time.
These findings highlight the influence of the switch settings on the experimental outcomes, demonstrating that identical settings yield correlated results, while varied settings result in random outcomes, consistent with the predictions of quantum mechanics.
Results explanation
The observations from the experimental runs can be explained using the principles of quantum mechanics, particularly the properties of particles in a singlet state.

In a singlet state, the total spin of the system is zero, meaning the spins of the individual particles are entangled and always opposite in orientation. When the spins of these entangled particles are measured along directions separated by 120^\circ, quantum theory predicts that the probabilities of the spins being aligned are governed by the formula:
P = \left(\cos(120^\circ)\right)^2 = \frac{1}{4}
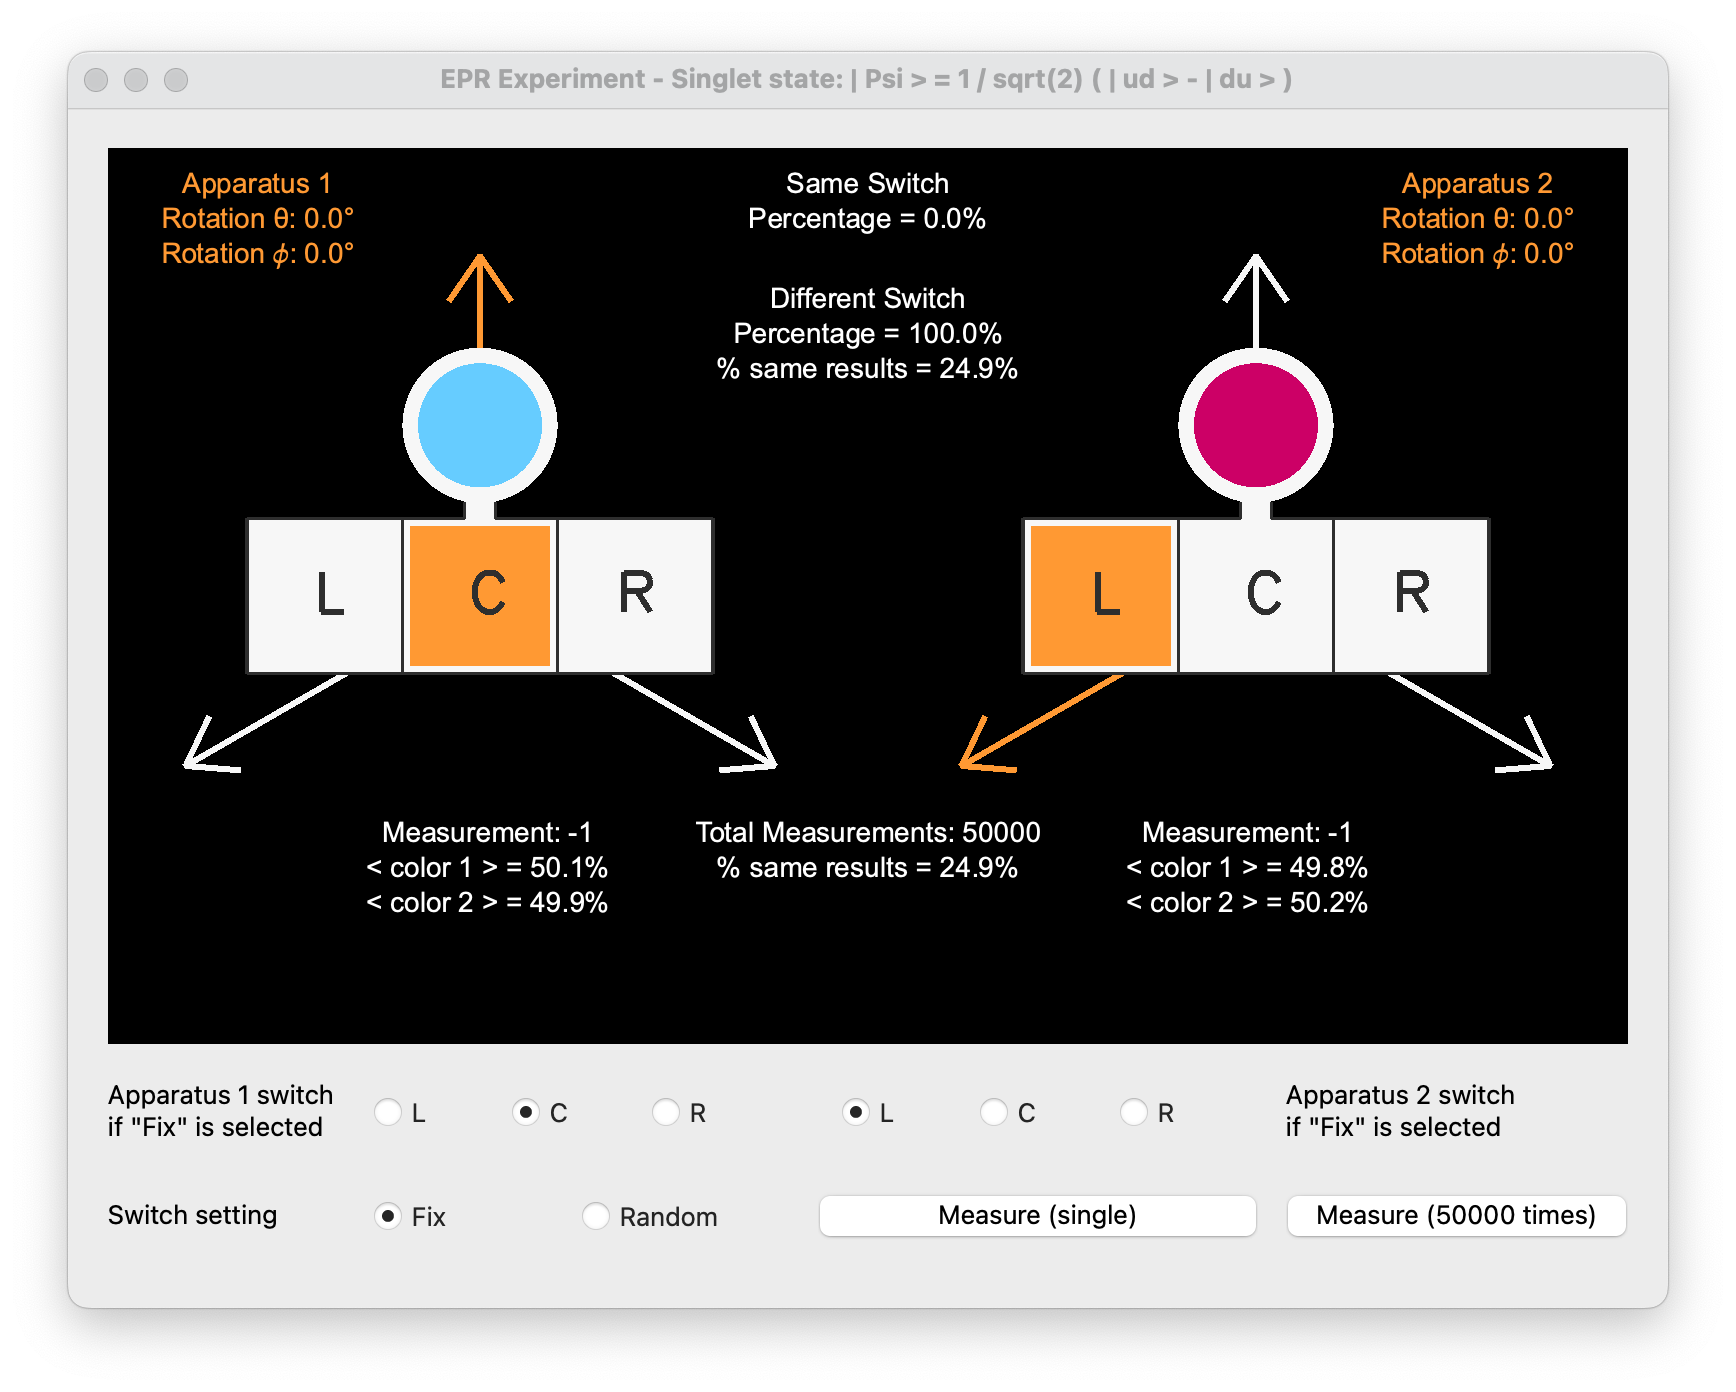
This theoretical prediction aligns with experimental observations, showing that when measurements are taken at 120° relative to each other, the spins are the same only one-fourth of the time.
Combining these probabilities:
P_t = \frac{1}{3} \times 1 + \frac{2}{3} \times \frac{1}{4} = \frac{1}{3} + \frac{1}{6} = \frac{1}{2}
Therefore, across all runs, the probability that the detectors flash the same color is \frac{1}{2}, matching the observed experimental statistics. This calculation and the experimental outcomes provide strong support for the quantum mechanical description of particle entanglement and spin correlation in a singlet state.
Quantum mechanic description
The proof outlined here relies on established quantum mechanical principles concerning the behavior of particles in entangled states. These principles will not be derived from first principles in this discussion but will be directly applied as they are well-documented in the existing literature on quantum mechanics.
The source emitting pairs of spin-½ particles in a singlet state, with each particle moving toward a separate detector. The wavefunction characterizing the singlet state is denoted as:
\psi = \frac{1}{\sqrt 2}(| ud \rangle - | du \rangle)
Each detector in this setup incorporates a Stern-Gerlach magnet, which can be oriented along one of three directions perpendicular to the particles’ trajectory and are angularly separated by 120°.
The experimental apparatus is equipped with a button that selects the orientation of the Stern-Gerlach magnets. As each particle passes between the poles of its respective magnet, it is deflected either northward or southward. This deflection corresponds to the particle’s spin state, either up (spin up) or down (spin down).
The detection mechanism is color-coded: the first detector flashes red for spin up and blue for spin down, while the second detector uses the reversed color scheme—blue for spin up and red for spin down. This arrangement ensures that any correlated pairs, as predicted by the singlet state, will result in opposite color indications at the detectors. A simultaneous red-red or blue-blue outcome confirms the anti-correlation property of the singlet state, as required by quantum mechanics.
Consider a scenario where both detectors are configured to measure spin along the same axis (i.e. the same button is pressed on both), and the first detector flashes red, corresponding to detecting spin up (| u \rangle). Upon this measurement, the wavefunction of the entangled singlet state collapses to:
\psi_c = | ud \rangle

Consequently, the second detector, due to the entanglement and opposite spin setup, detects spin down (| d \rangle) and also flashes red, as its color indicators are set in reverse to the first detector’s. Should the first detector flash blue, indicating spin down (| d \rangle), the wavefunction similarly collapses to:
\psi_c = | du \rangle
In this case, the second detector detects spin up (| u \rangle) and flashes blue, maintaining consistency in the display of colors under the reverse setup. This consistency underscores the perfect anti-correlation (-1) inherent in the singlet state, ensuring that identical settings on the detectors always result in agreement in the colors displayed, though opposite in spin.
When both detectors are set to the a different box we can use the expectation formula (where \mathbf a and \mathbf b are two vectors and \theta_{\mathbf a \mathbf b} the angle between) for the probability amplitude as:
E_{\mathbf a \mathbf b} = \langle \psi | \sigma^1_{\mathbf a} \otimes \sigma^2_{\mathbf b} | \psi \rangle = -\cos(\theta_{\mathbf a \mathbf b})
selecting an angle of ±120°:
E_{\mathbf a \mathbf b} = - \cos\left(\pm \frac{2}{3}\pi\right) = \frac{1}{2}

So the probability of correlated outcomes is:
P = \left(E_{\mathbf a \mathbf b}\right)^2 = \frac{1}{4}
In this experimental setup, switches on detectors can be set to three distinct positions labeled as L, C, and R. Each detector’s setting is independently and randomly chosen for each experimental run, leading to various combinations of settings between two detectors:
-
Identical Settings: The combinations where both detectors have the same setting (
LL,CC,RR) occur with a probability of ⅓, because there are three combinations out of nine total possible combinations where the settings match. -
Different Settings: Combinations where the detectors’ settings differ (
LC,CL,LR,RL,CR,RC) make up the remaining ⅔ of the possible settings.
Summarizing the probability calculation:
-
Identical Settings: When the settings are identical, the quantum mechanical properties of entangled particles ensure that the detectors always agree in their measurement outcomes. This is consistent with the correlation of a singlet state, where entangled particles measured along the same axis always result in opposite spins, leading to the same outcome due to opposite color setups. Therefore, the probability of agreement in this case is 1.
-
Different Settings: When the settings differ, the probability that the detectors agree (i.e., flash the same color) is ¼. This is calculated based on the quantum mechanical predictions for measurements at relative angles (like 120° as previously discussed), where the likelihood of detecting the spins in the same state is given by cos²(120°) = ¼.
Combining these probabilities gives the overall probability of the detectors agreeing on the color flashed:
P_t = \frac{1}{3} \times 1 + \frac{2}{3} \times \frac{1}{4} = \frac{1}{3} + \frac{1}{6} = \frac{1}{2}

Thus, across all runs, the expected probability that the two detectors will agree on the color they flash, regardless of the setting, averages to 50%. This statistical analysis aligns with the experimental observations and quantum mechanical theory, demonstrating the inherent randomness and quantum correlations in the measurements of entangled particles.
References
BELL, John S., 1964. On the Einstein Podolsky Rosen paradox. Physics 1, 195 (1964).
MERMIN, David, 1985. Is the Moon There When Nobody Looks? Reality and the Quantum Theory. Physics Today, 38, pp. 38-47.