The Hydrogen Atom - Orbitals Visualization
In this page I explore the dedicated of the exploration of the orbitals of the hydrogen atom. Building upon the mathematical detailed in my previous sections here, I now venture into the visual realm to demystify the intricate world of atomic orbitals. The transition from abstract mathematical expressions to concrete visual representations enables a profound understanding of the hydrogen atom’s structure.
This page is divided into two primary focuses: the radial wavefunctions and the orbital probability densities. Through carefully crafted visualizations, we aim to illuminate the characteristics and behaviors of various orbitals, showcasing how the elegance of quantum mechanics manifests in the hydrogen atom’s electron configurations. From the fundamental 1s orbital to the more complex 3d states, each visualization serves as a window into the probabilistic nature of quantum systems, bringing to light the fascinating interplay between mathematical theory and physical reality.
Radial wavefunctions
The visualization of radial wavefunctions offers a unique insight into the probabilistic nature of electron positions within the hydrogen atom. Following a detailed mathematical derivation presented on another page, I now turn my attention to plotting some of these pivotal functions. The radial wavefunctions, represented mathematically by solutions to the Schrödinger equation, encapsulate the essence of an electron’s behavior at various distances from the nucleus. Through graphical representations, I aim to bridge the abstract and the observable, providing a visual interpretation of these fundamental components of quantum systems. This exploration not only enhances comprehension of the theoretical underpinnings but also reveals the intricate patterns and symmetries inherent in atomic structures.
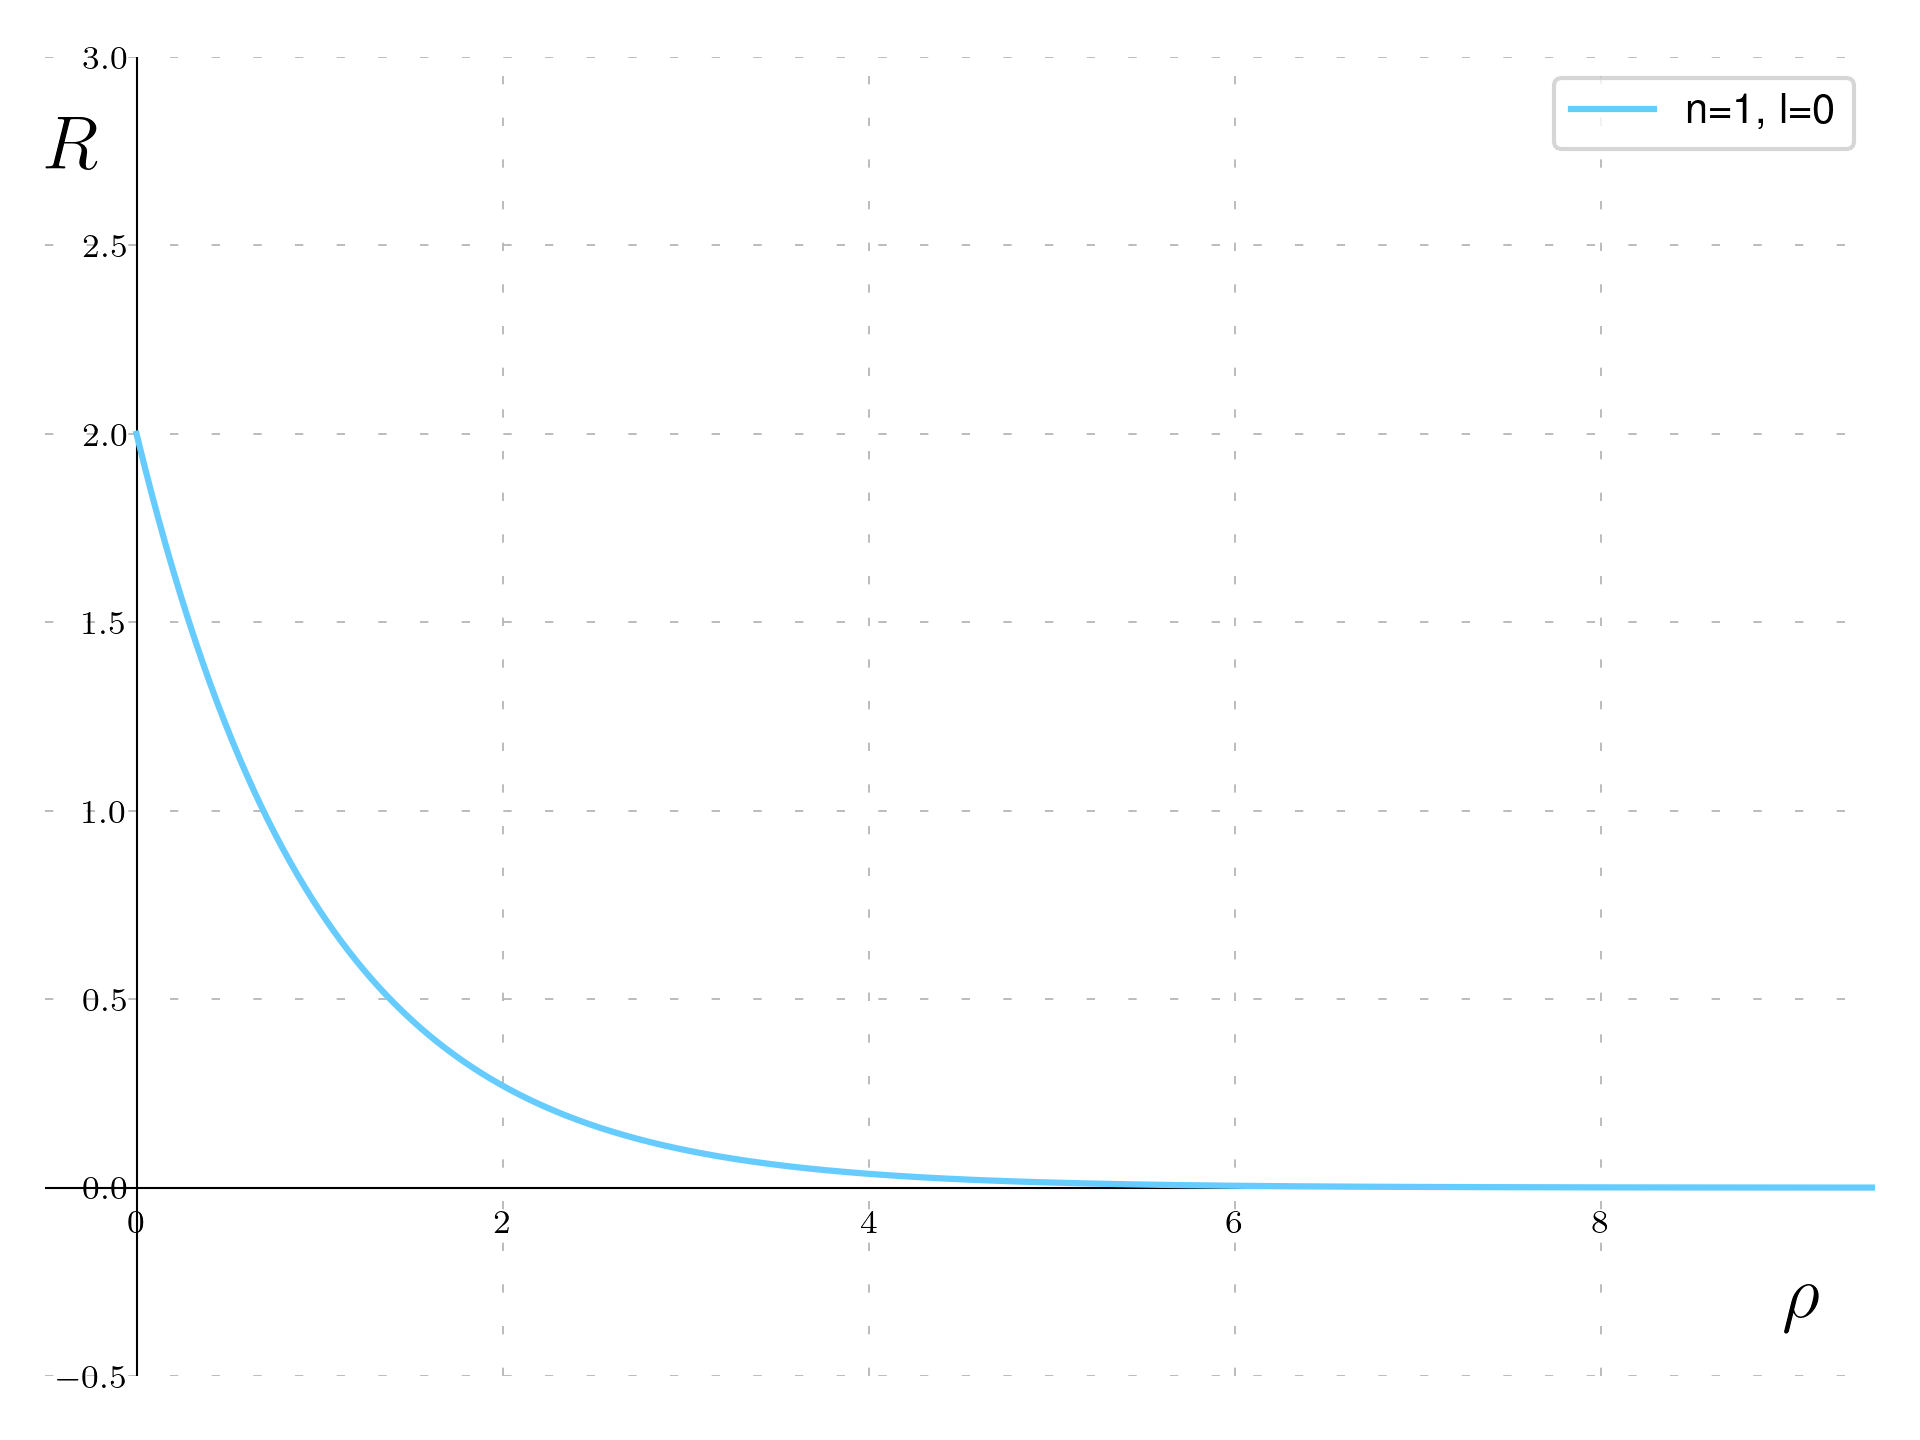
For n=1 there is a single function for \ell=0, the function has the form:
R_{1,0}(\rho) = 2e^{-\rho}
This is a function that simply decrease exponentially with a length of the Bohr radius.
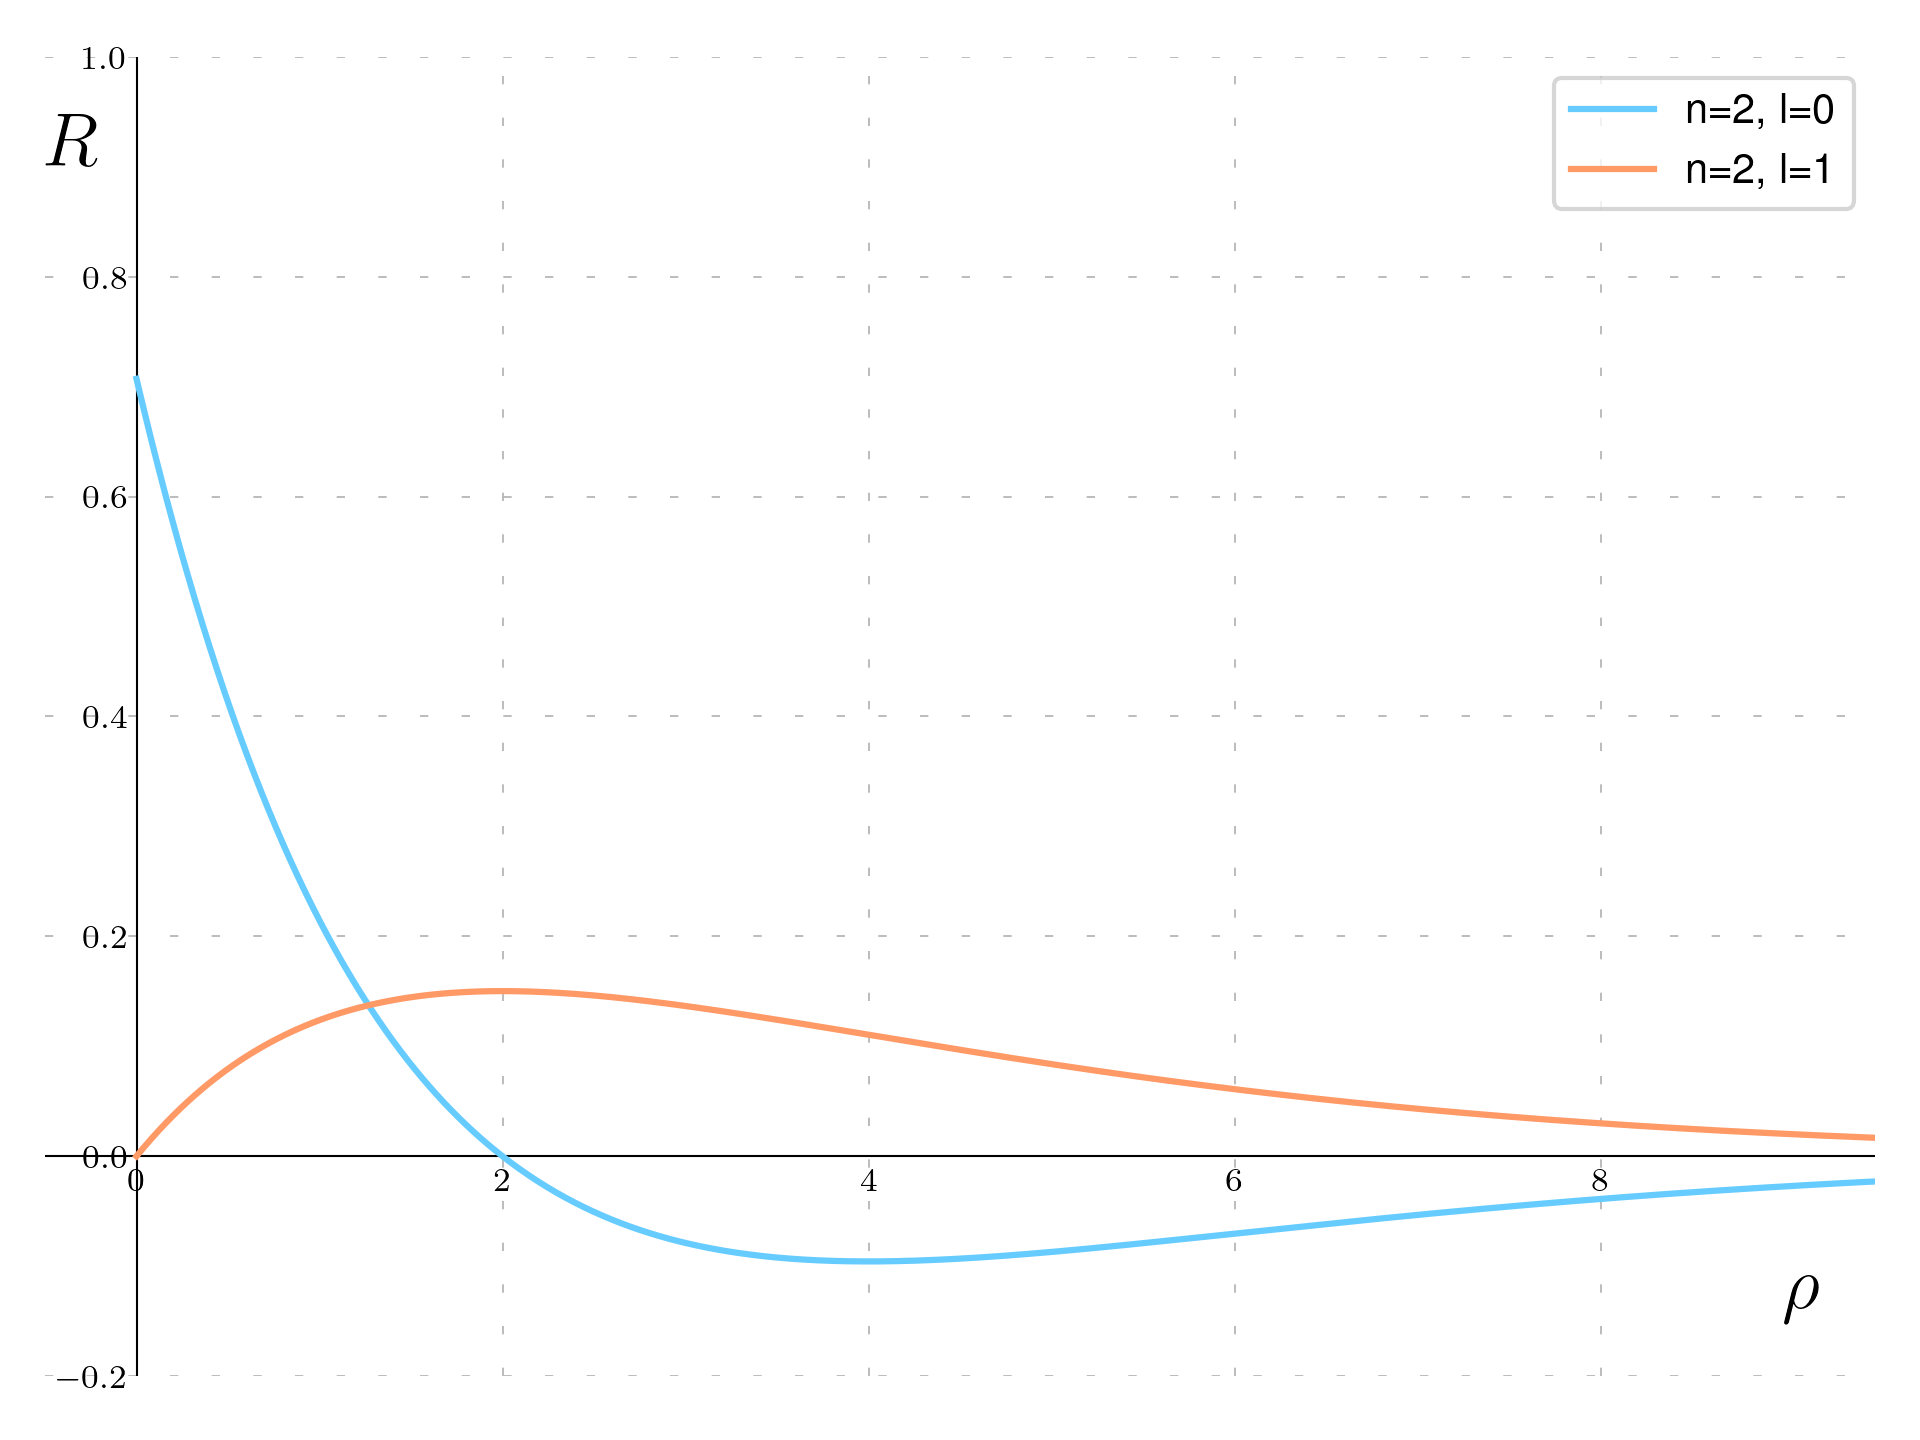
Going to the n=2 state there are two functions:
\begin{aligned} & R_{2,0}(\rho) = \frac{\sqrt{2}}{4}(2-\rho)e^{-\frac{\rho}{2}} \\ & R_{2,1}(\rho) = \frac{\sqrt{6}}{12}\rho e^{-\frac{\rho}{2}} \end{aligned}
We observe distinct behaviors in their radial wavefunctions. Specifically, for the \ell=0 state with n=2, represented by the blue curve, the radial wavefunction formula is 2 - \rho multiplied by \exp(-\rho/2). This adjustment results in the wavefunction extending further due to a slower exponential decay compared to the n=1 state, which was governed by \exp(-\rho). The presence of the 2 - \rho term indicates a zero crossing at \rho = 2, which corresponds to two Bohr radii from the nucleus, highlighting a distinctive node in the wavefunction.
For the \ell=1 radial function, illustrated by the orange curve, the inclusion of a \rho term leads to the wavefunction starting at zero at the origin. Despite sharing the same exponential decay factor of \exp(-\rho/2) with the \ell=0 state, which dictates the rate at which the wavefunction diminishes at larger distances, this function uniquely does not cross zero beyond the origin. This characteristic underscores the influence of the azimuthal quantum number on the spatial distribution of the wavefunction, with the \ell=1 state exhibiting a node at the center but remaining positive or negative elsewhere.
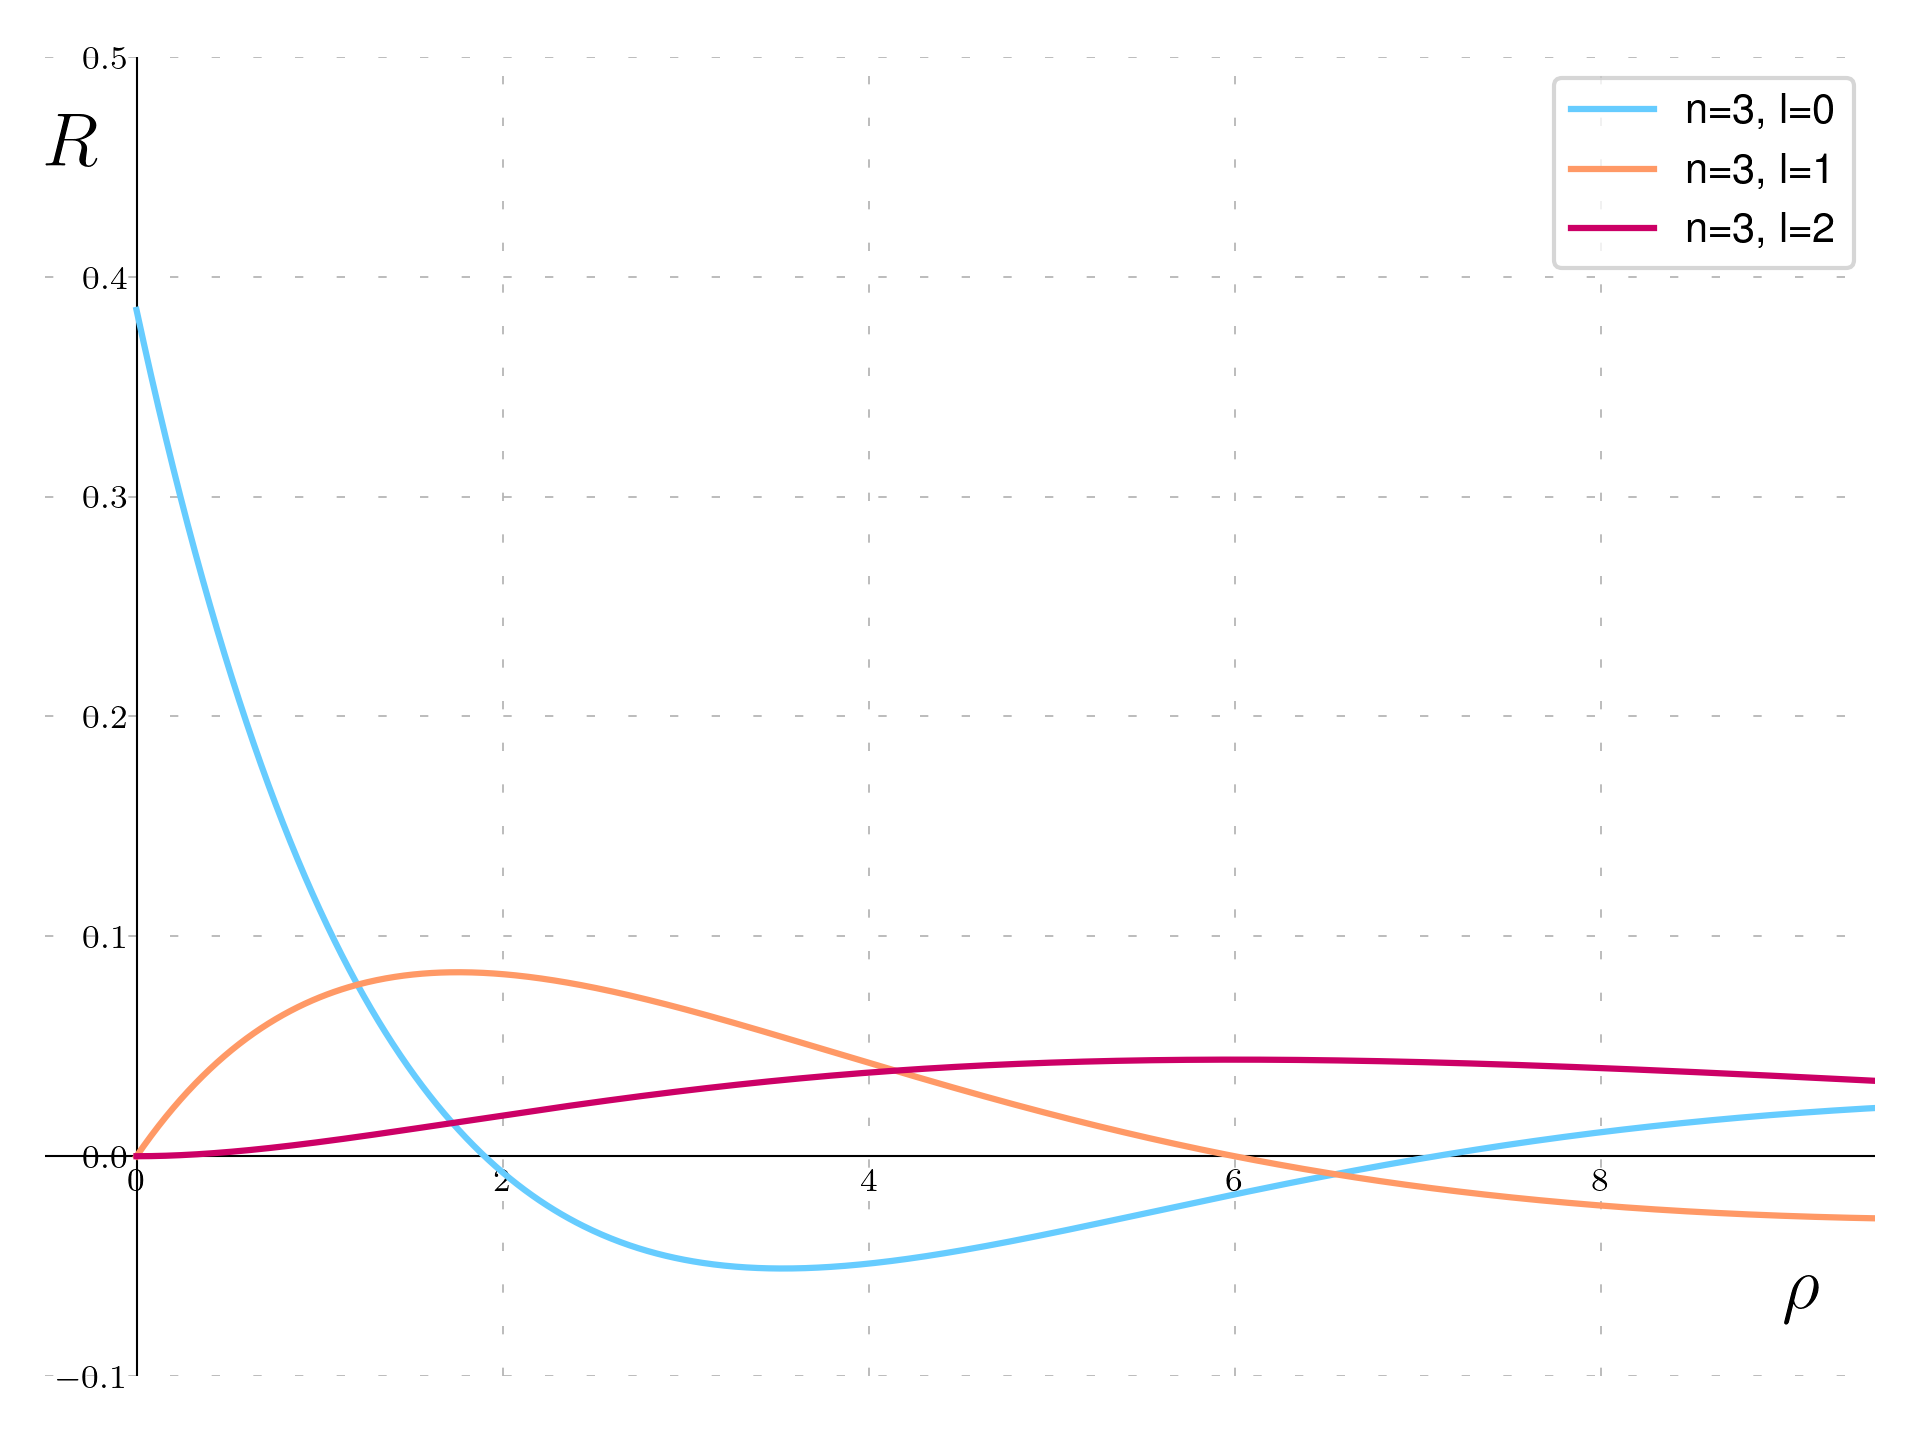
Going to the n=3 state there are three functions:
\begin{aligned} & R_{3,0}(\rho) = \frac{2}{\sqrt{27}}\left(1 - \frac{2}{3}\rho + \frac{2}{27}\rho^2\right)e^{-\frac{\rho}{3}} \\ & R_{3,1}(\rho) = \frac{8}{\sqrt{6}27}\rho\left(1 - \frac{1}{6}\rho\right)e^{-\frac{\rho}{3}} \\ & R_{3,2}(\rho) = \frac{4}{81\sqrt{30}}\rho^2e^{-\frac{\rho}{3}} \end{aligned}
The \ell=0 state, depicted by the blue curve, features a quadratic polynomial multiplied by \exp(-\rho/3), indicating a slower rate of exponential decay compared to the n=1 and n=2 states. This slower decay is reflective of the higher n value, allowing the wavefunction to extend further from the nucleus. The quadratic nature of the function results in it crossing the axis twice, representing two nodes within the wavefunction.
The \ell=1 state is shown with the orange curve, characterized by the expression \rho(4 - \frac{2}{3}\rho) multiplied by the same decaying exponential, \exp(-\rho/3). This ensures the wavefunction starts at zero at the origin, increasing initially but eventually decreasing past a certain point due to the exponential factor. The linear term ensures a node at the origin, with another node occurring when the polynomial equates to zero, before the exponential decay dominates at larger distances.
Finally, the \ell=2 state, illustrated by the red curve, is represented by \rho^2 times \exp(-\rho/3). Starting from zero at the origin due to the \rho^2 term, this function increases to a maximum before following the same exponential decay pattern as the others. This behavior is consistent with a wavefunction that exhibits two nodes at the origin (due to the square of \rho), expanding outward before the exponential decay impacts the function’s behavior at larger \rho values.
In summary, the n=3 wavefunctions demonstrate a diversity in structure and decay rates, with the number of nodes and initial behavior at the origin differing across the \ell values, all decaying exponentially with \exp(-\rho/3) as they extend from the nucleus.
Orbital probability densities
In this analysis, I examine the probability densities derived from the hydrogen atom’s wavefunction. Initially, I explore the state (1,0,0), characterized by quantum numbers n=1, \ell=0, and m=0, by inspecting a cross-section at y=0 in the XYZ space, observing the XZ-plane slicing through the atom’s core.

For enhanced clarity, especially at greater distances from the nucleus and with \ell=0, I present along with the modulus of the wavefunction along with the probability density. This visualization method, emphasizing the wavefunction’s modulus over its squared magnitude, is chosen specifically to elucidate the orbital’s spatial features and nodal structures, offering an intuitive grasp of the wavefunction’s behavior, albeit at the expense of representing accurate probability densities.
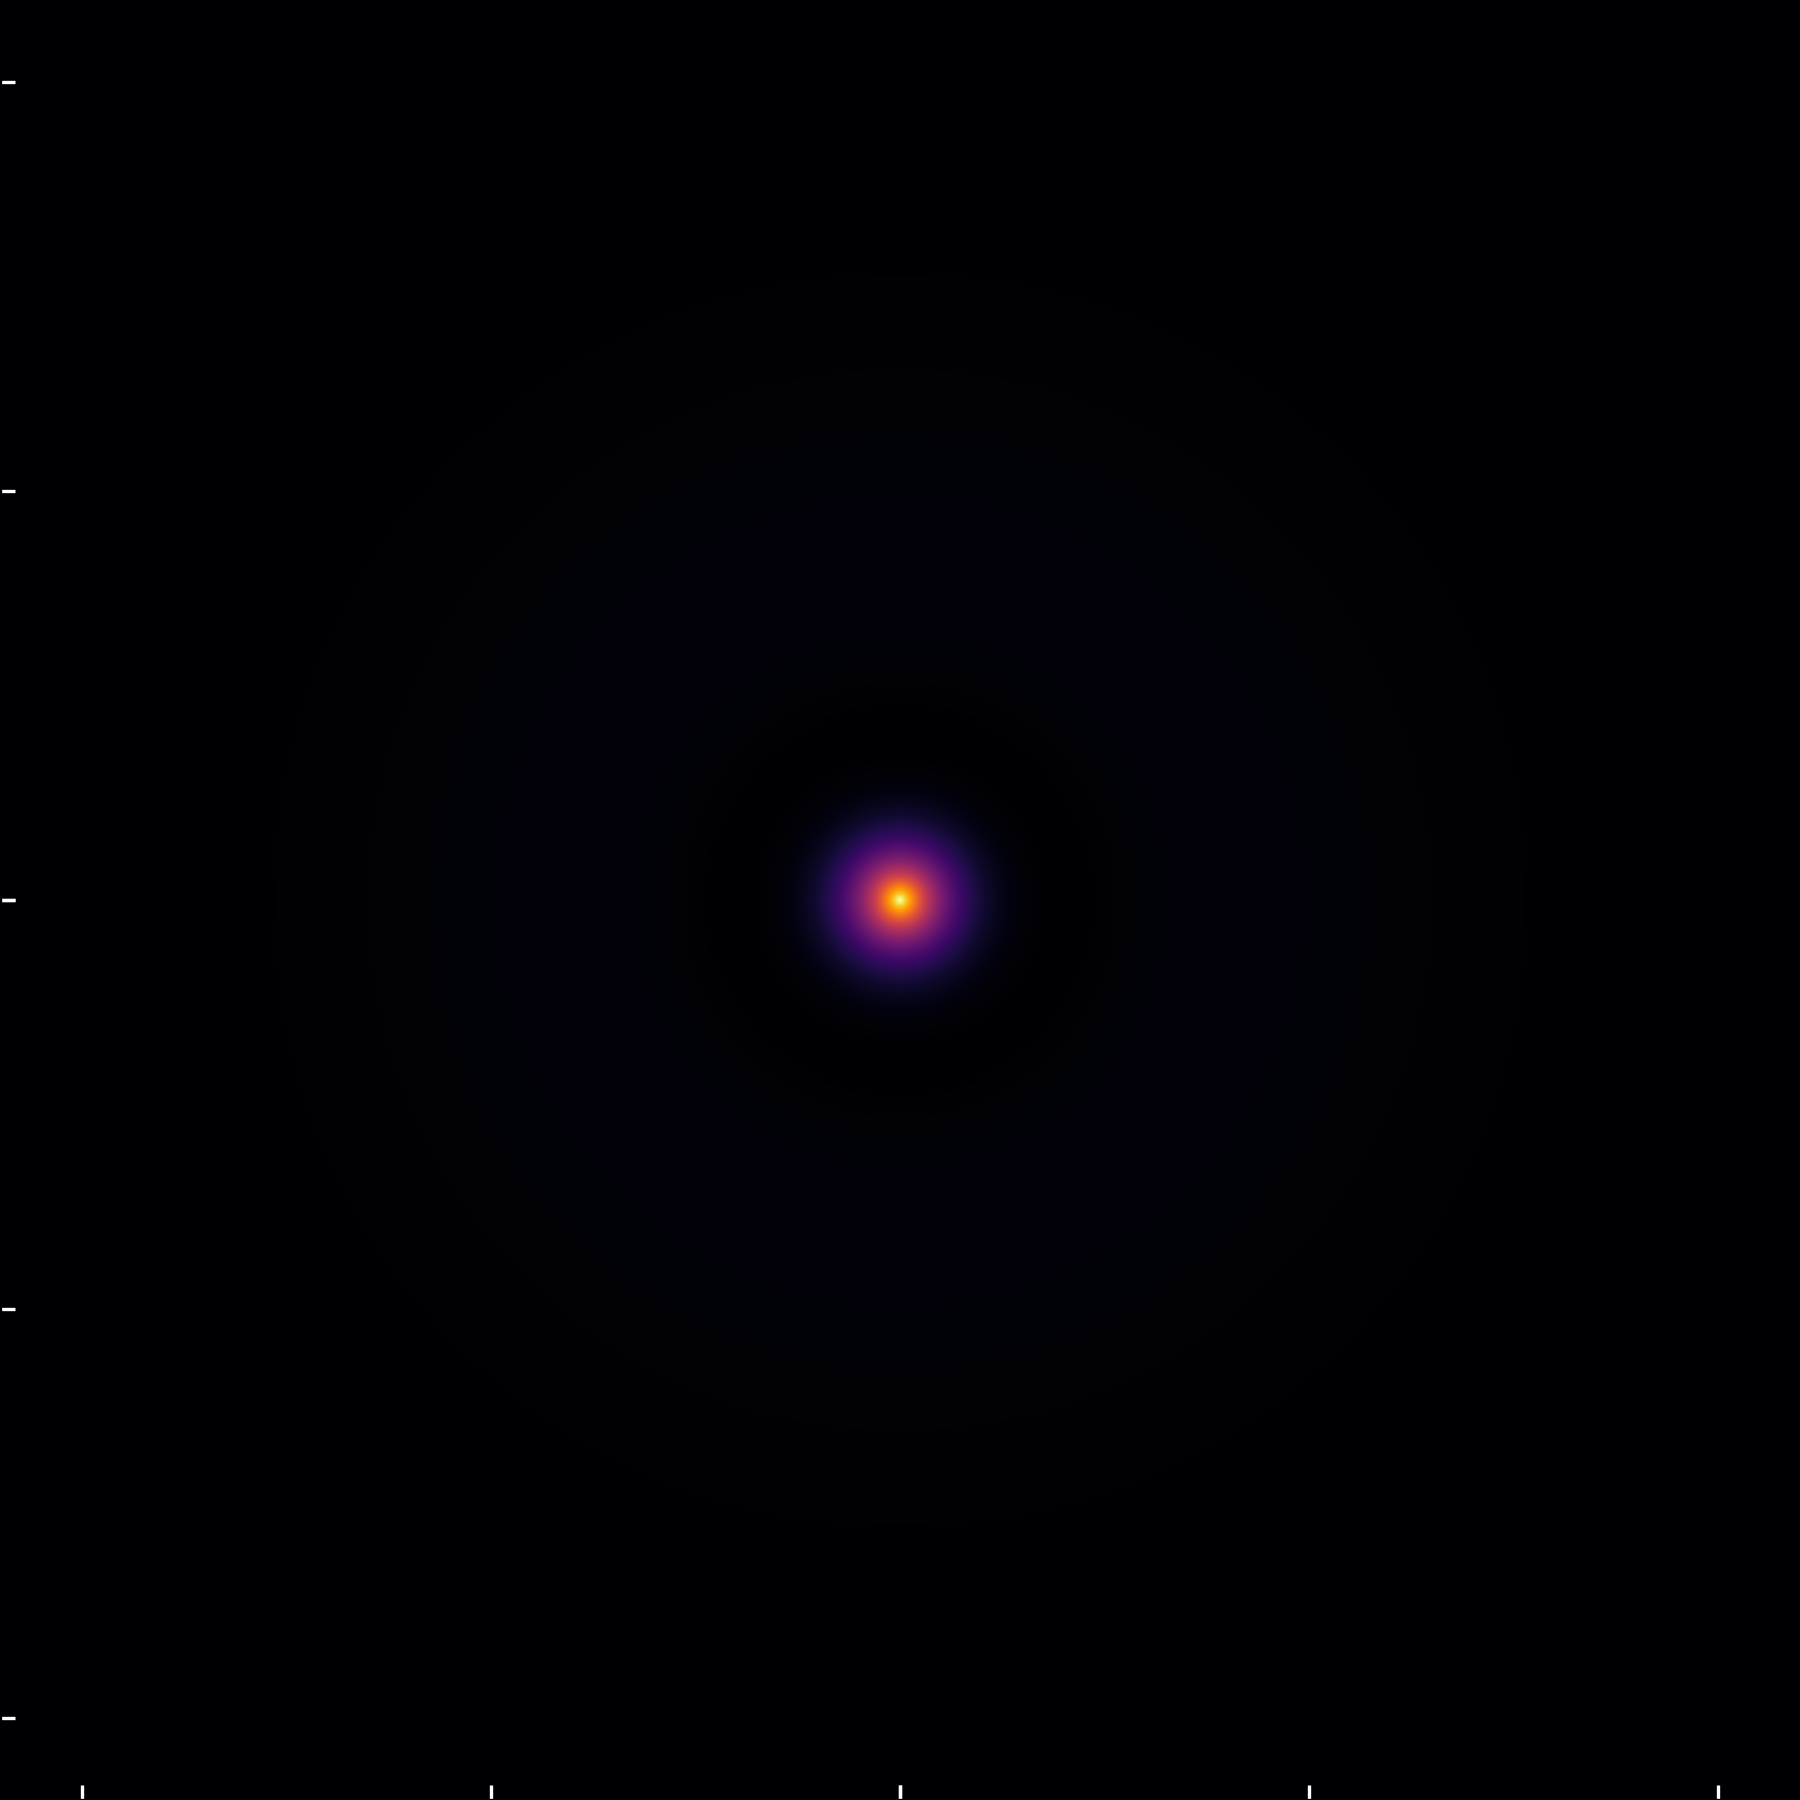
The (2,0,0) state, though seemingly similar to the (1,0,0) state on a straightforward scale, reveals its unique characteristics when plotting the modulus of the wavefunction.
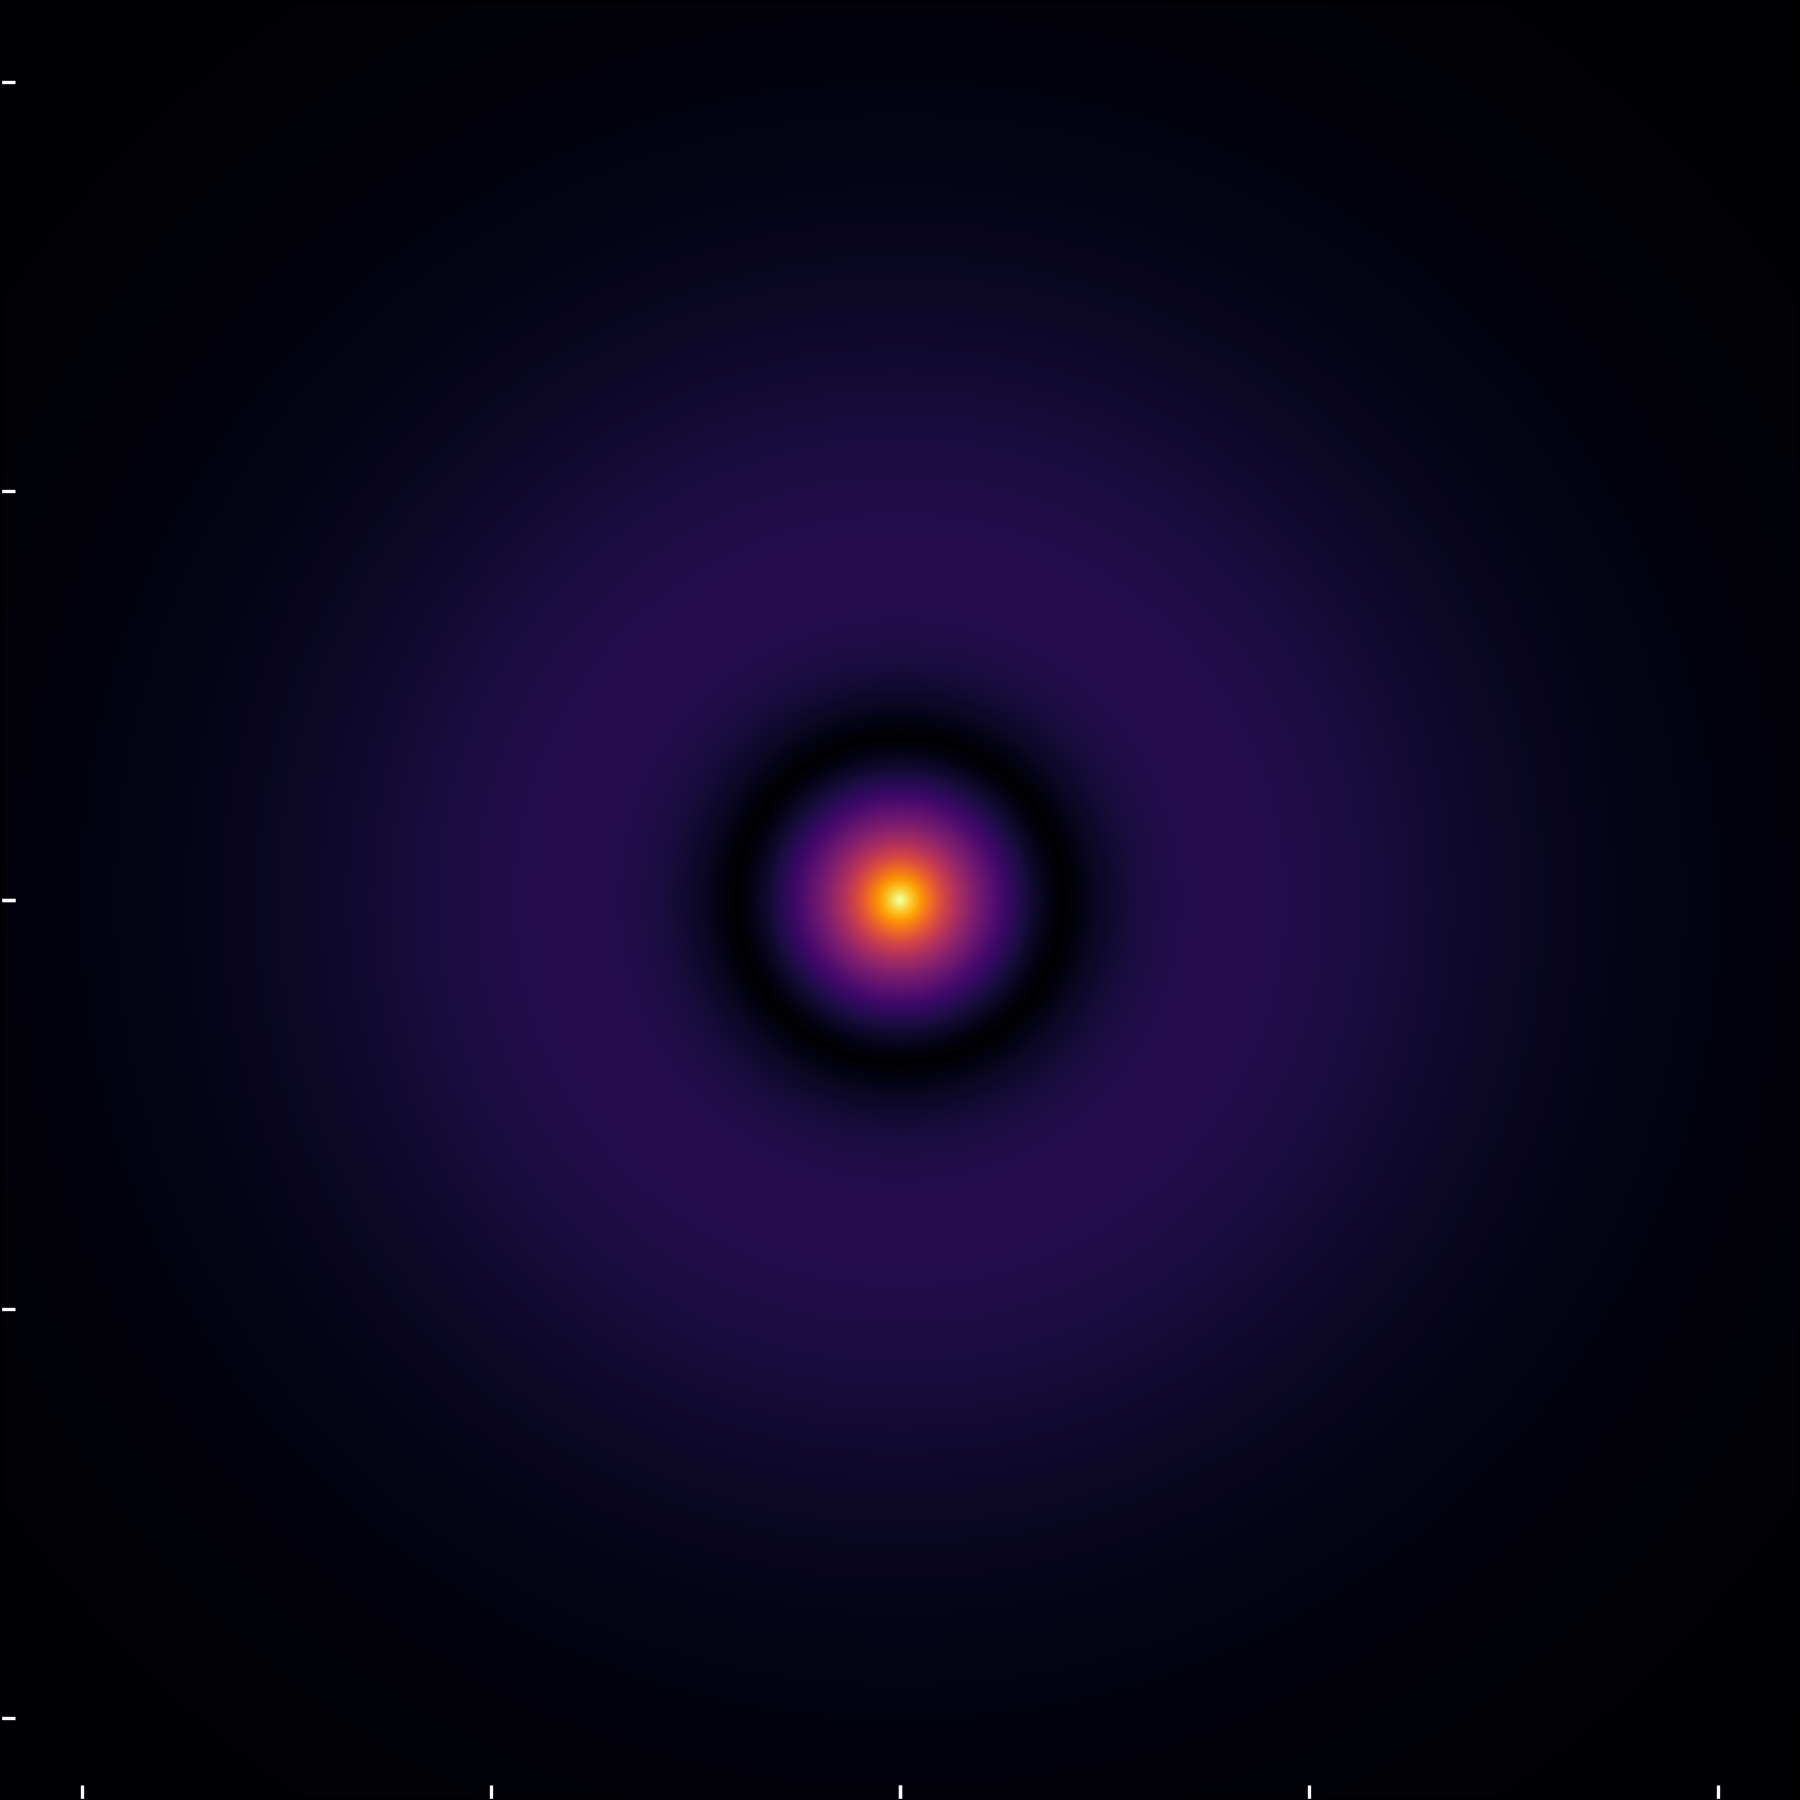
This view highlights the orbital’s radial node, where the probability density momentarily drops to zero before increasing and eventually tapering off.
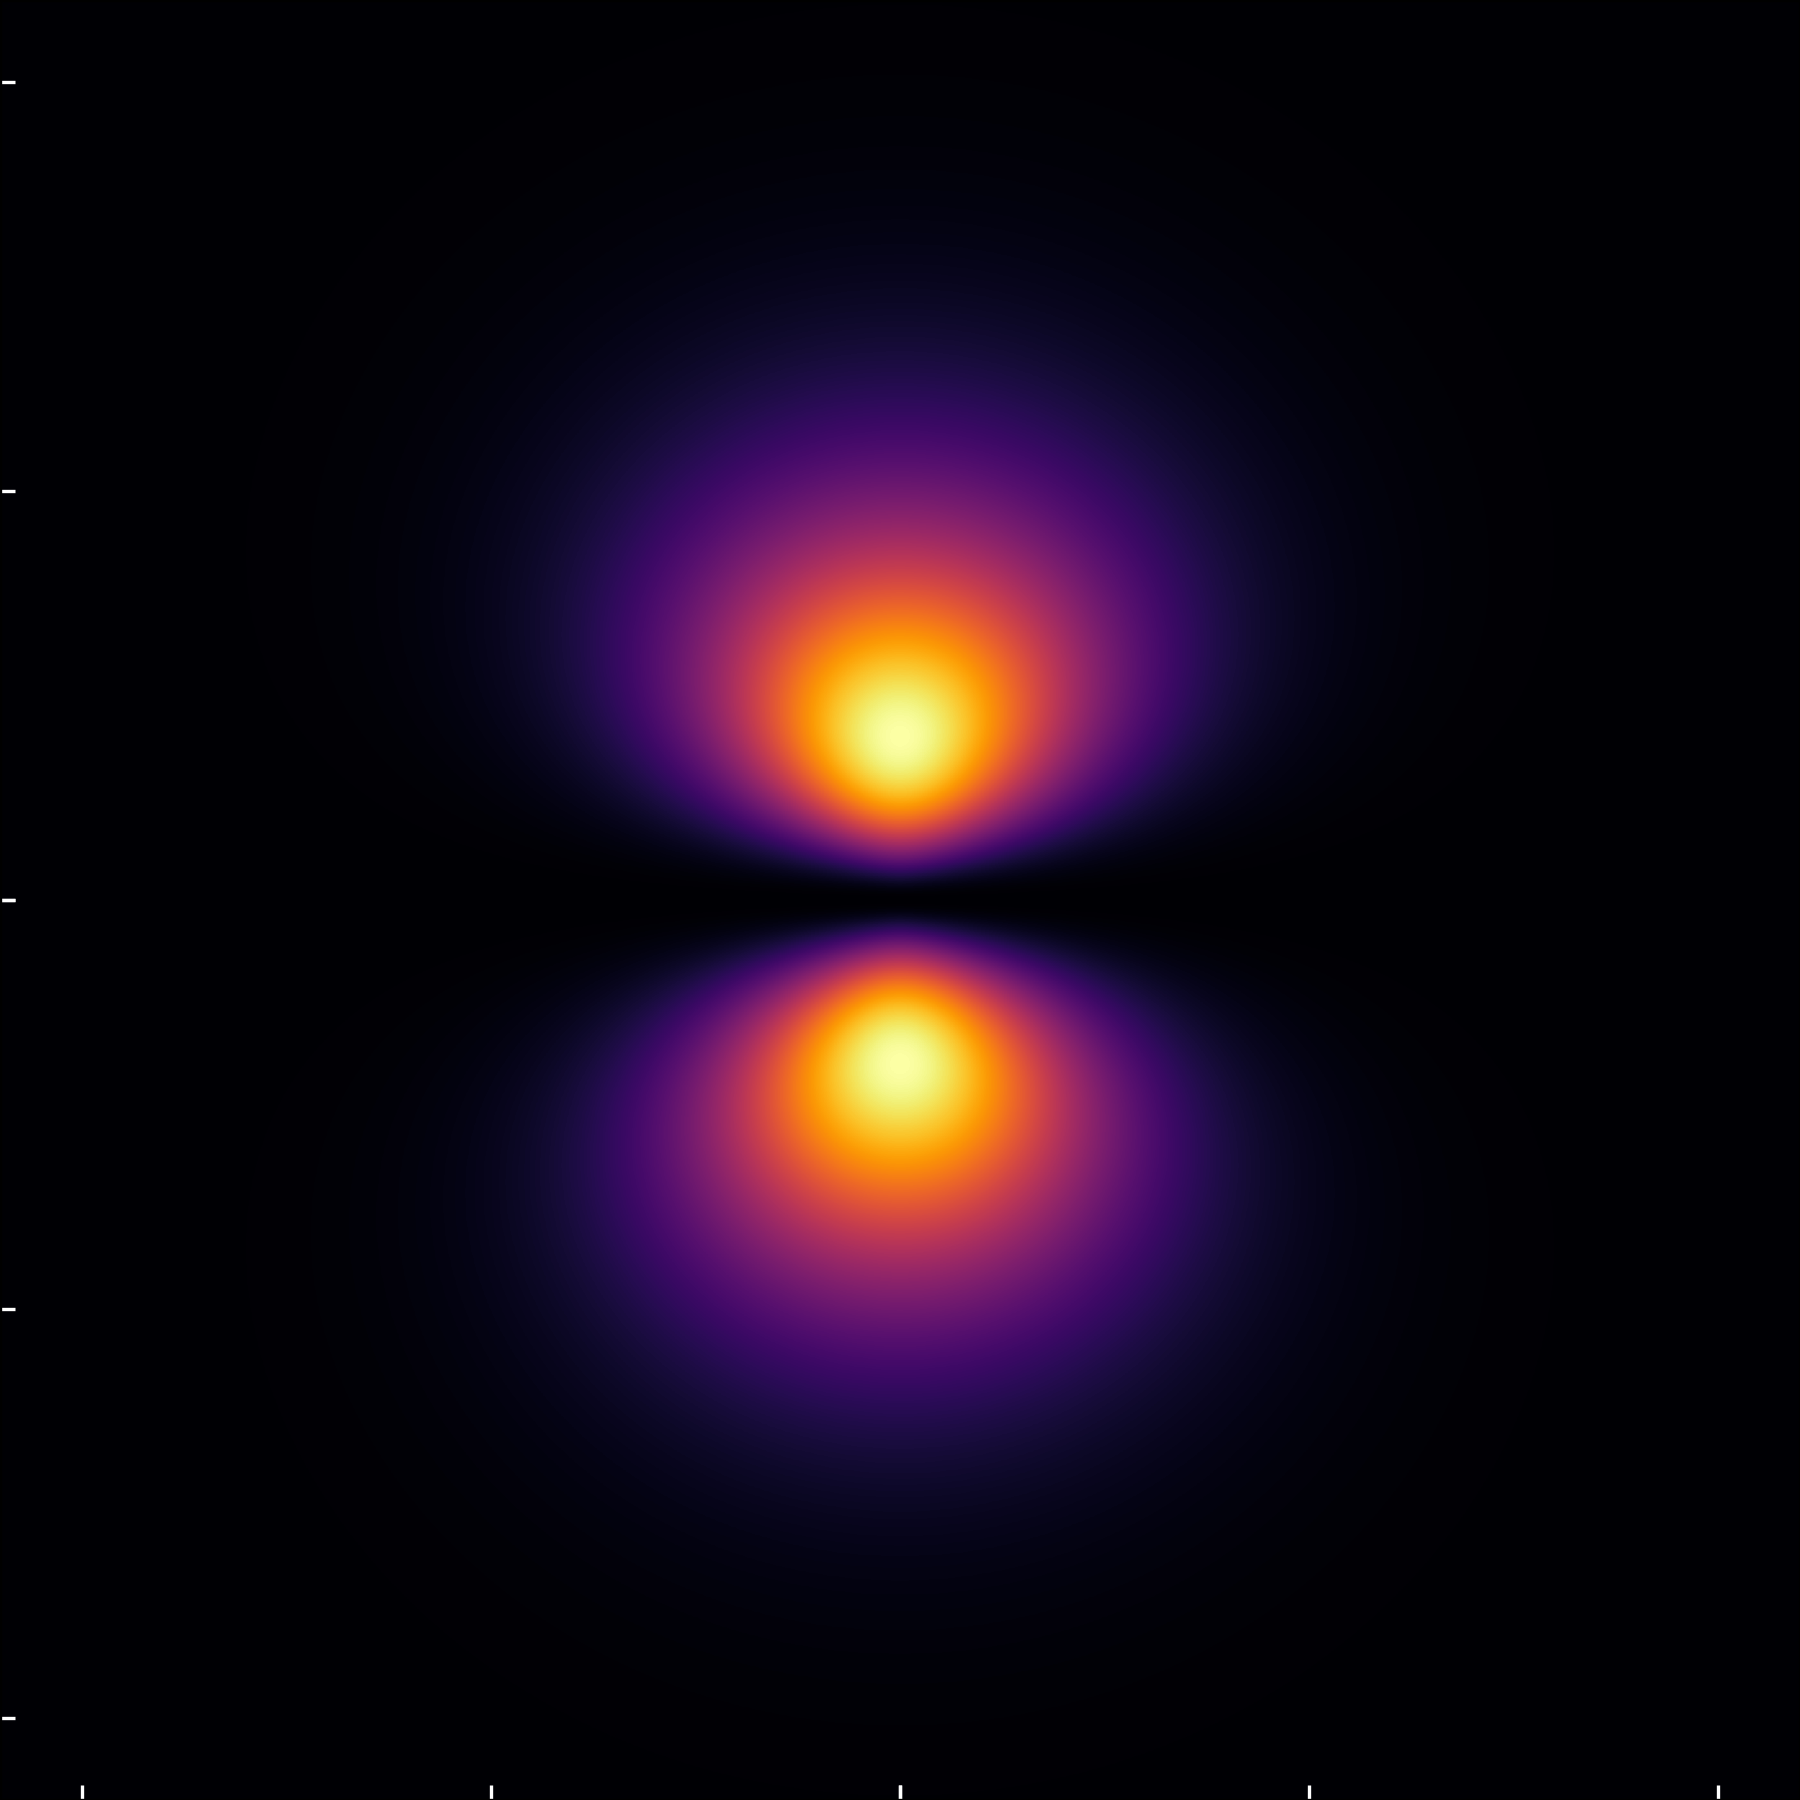
Similarly, the (2,1,0) state exhibits dual lobes orbitals, with a notable exponential decay in radial direction. Despite visualizing the probability density, the depiction shows a nodal circle, effectively dividing the wavefunction into distinct lobes of positive and negative values in the wavefunction itself.
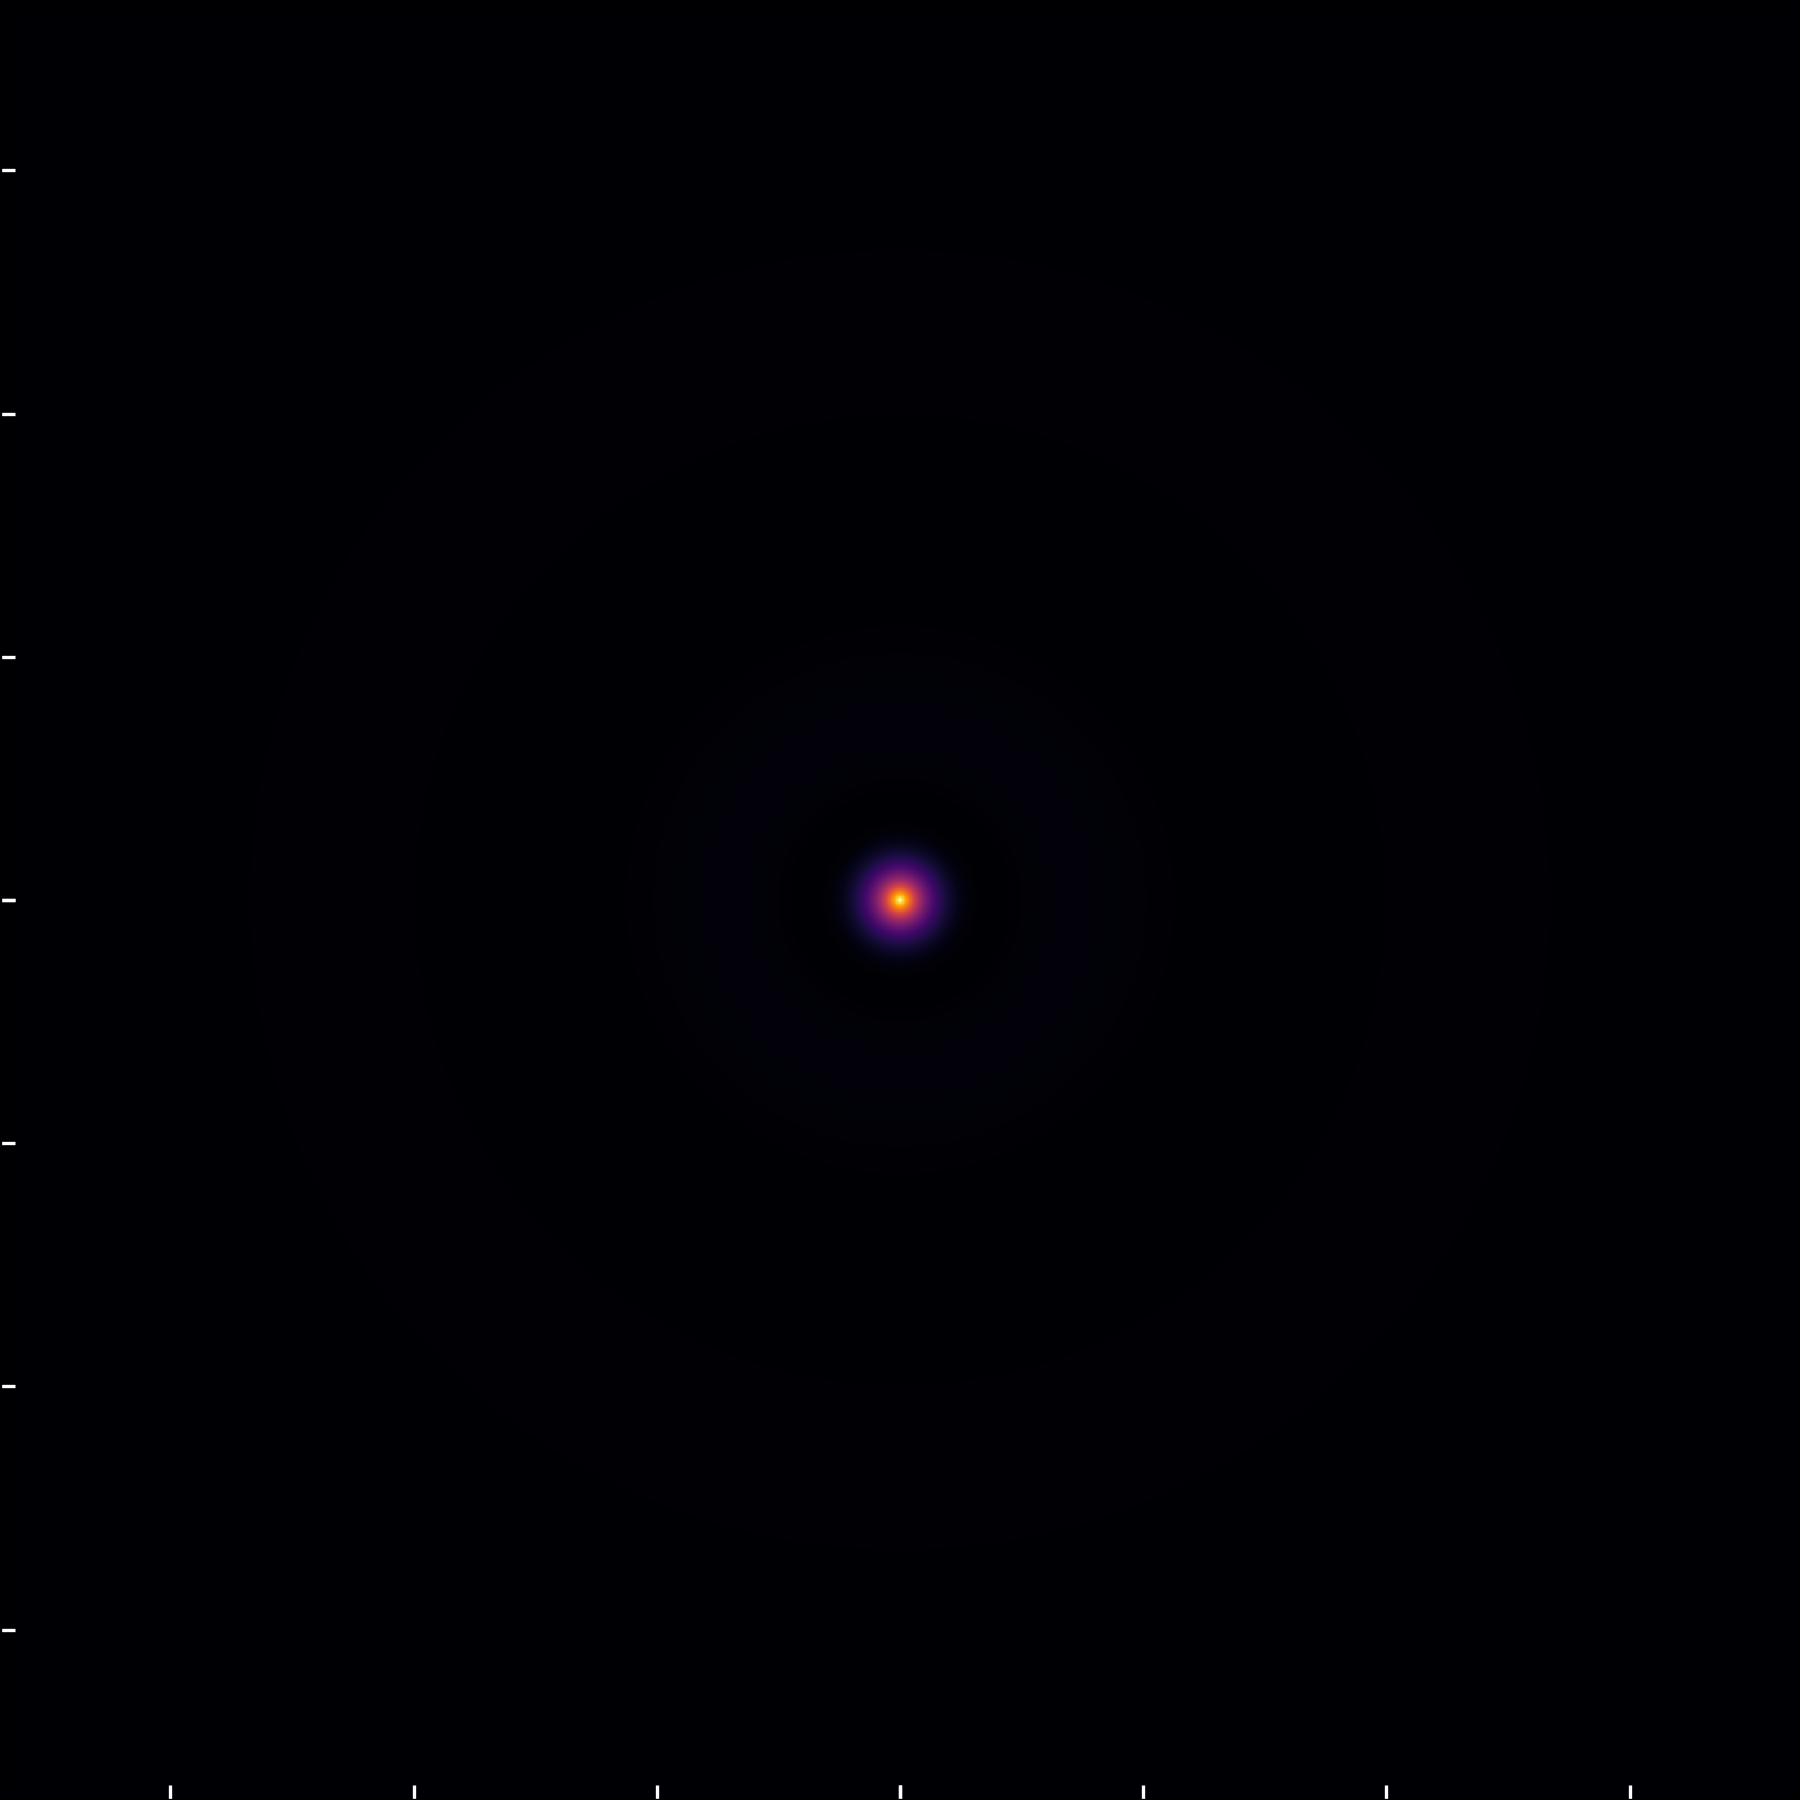
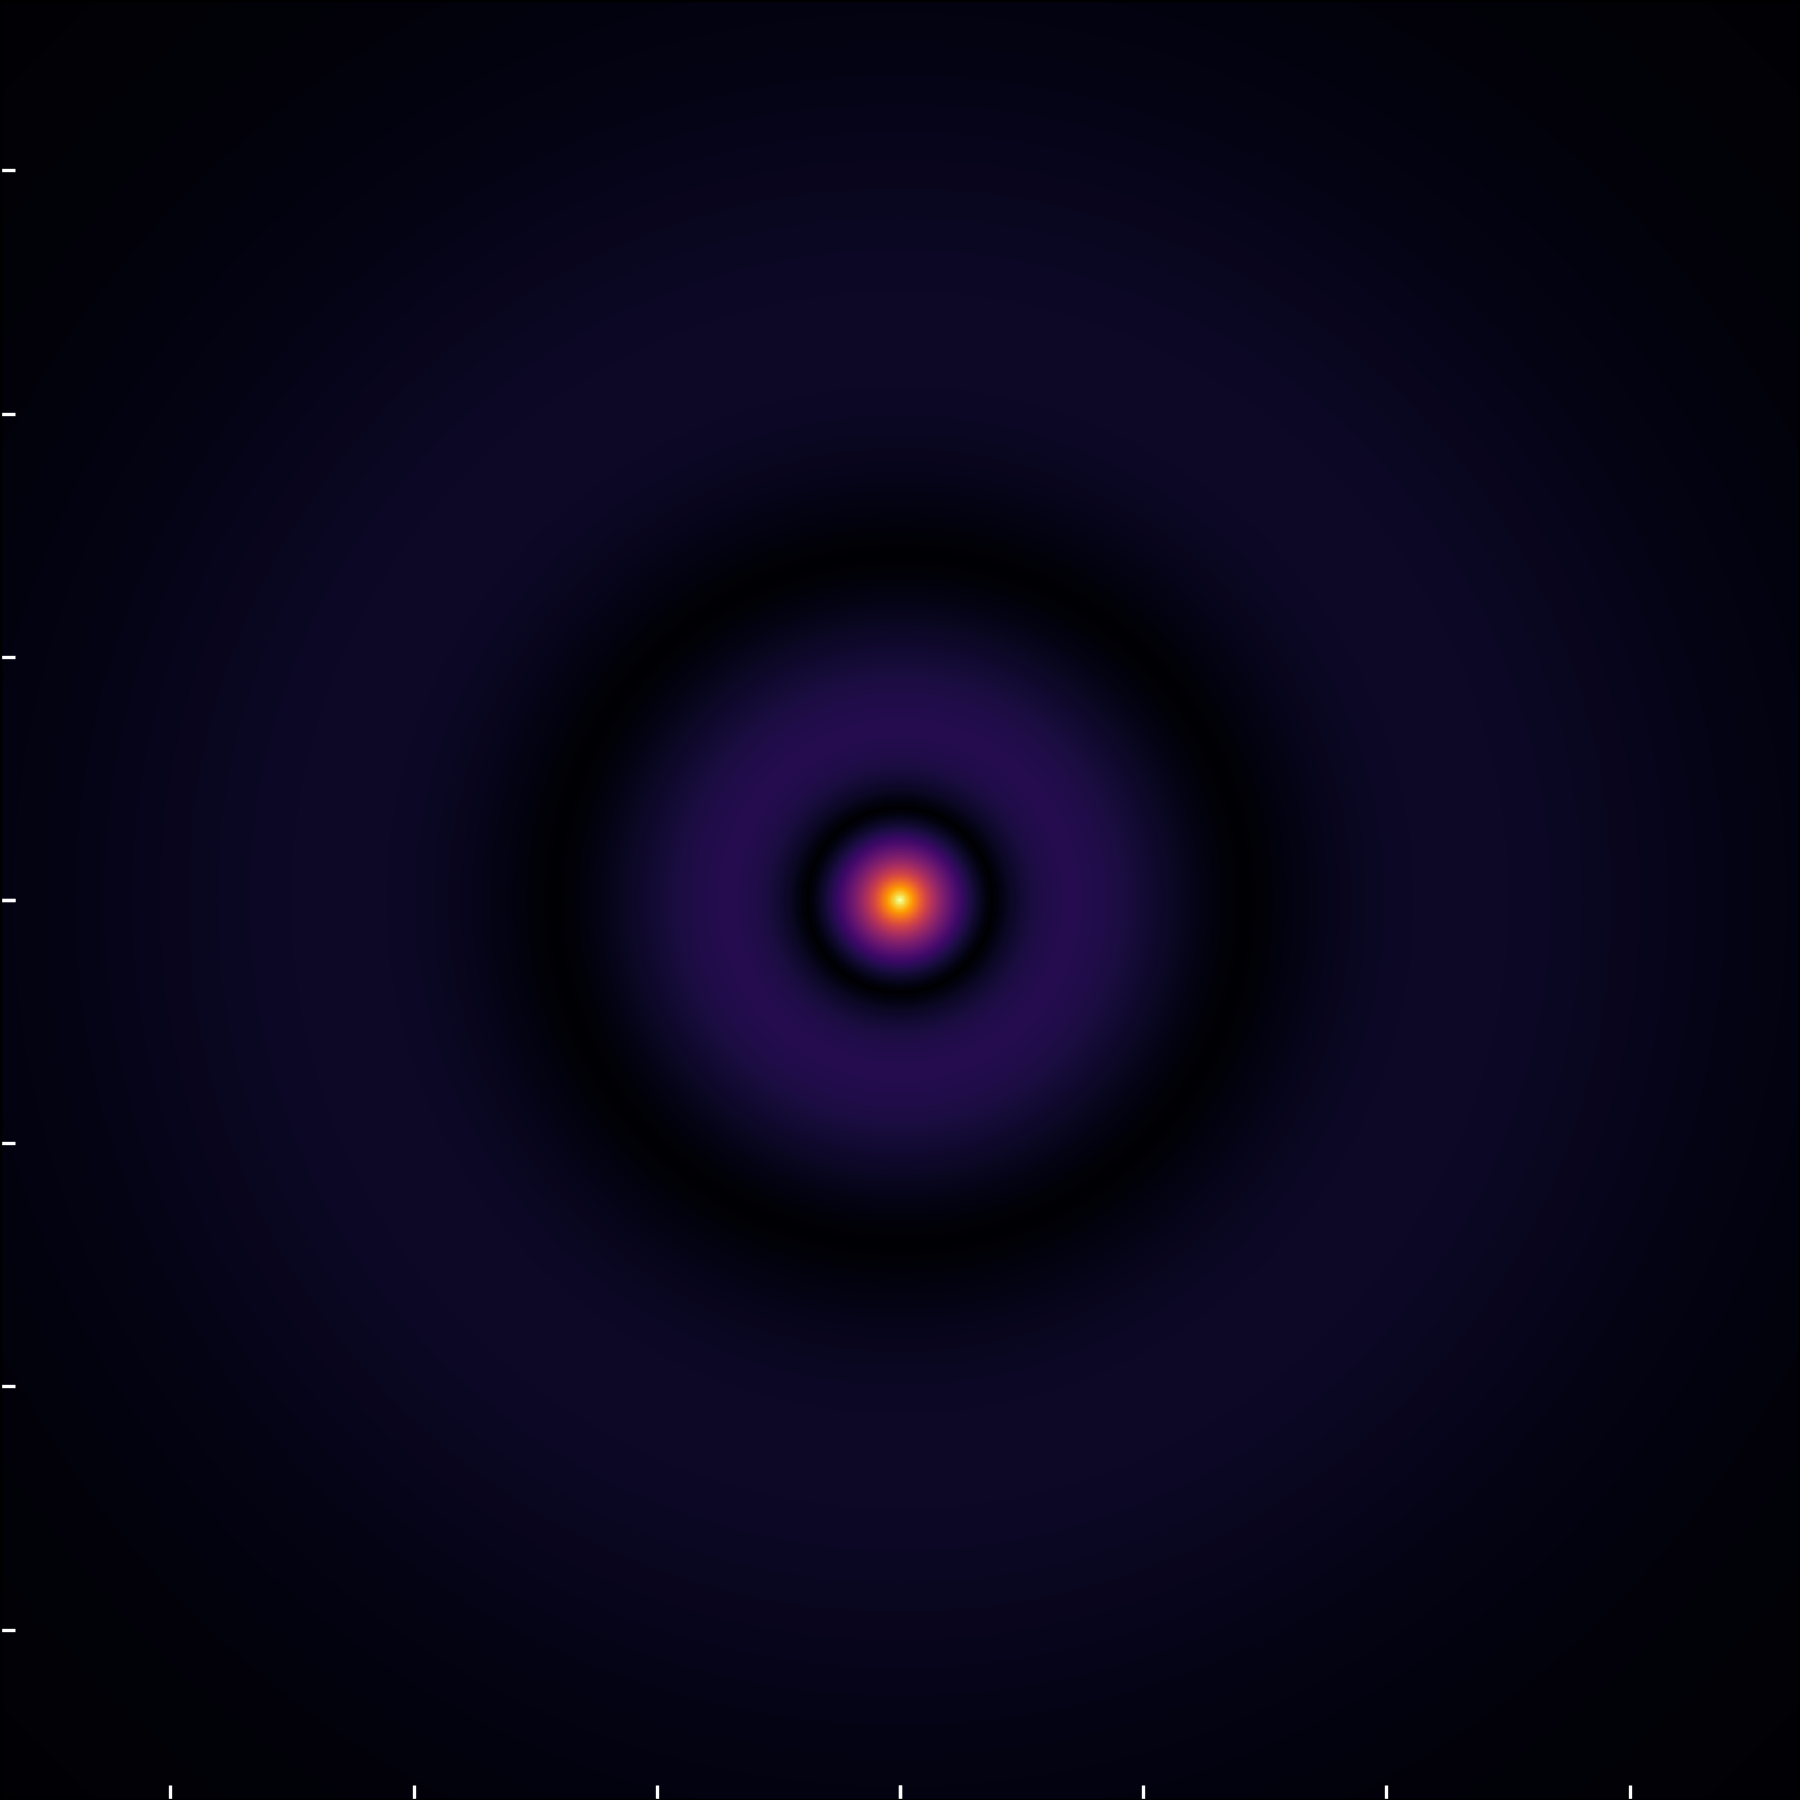
When examining the (3,0,0) state through the wavefunction module, we observe two radial nodes, aligning with expectations for an n=3, \ell=0 orbital.
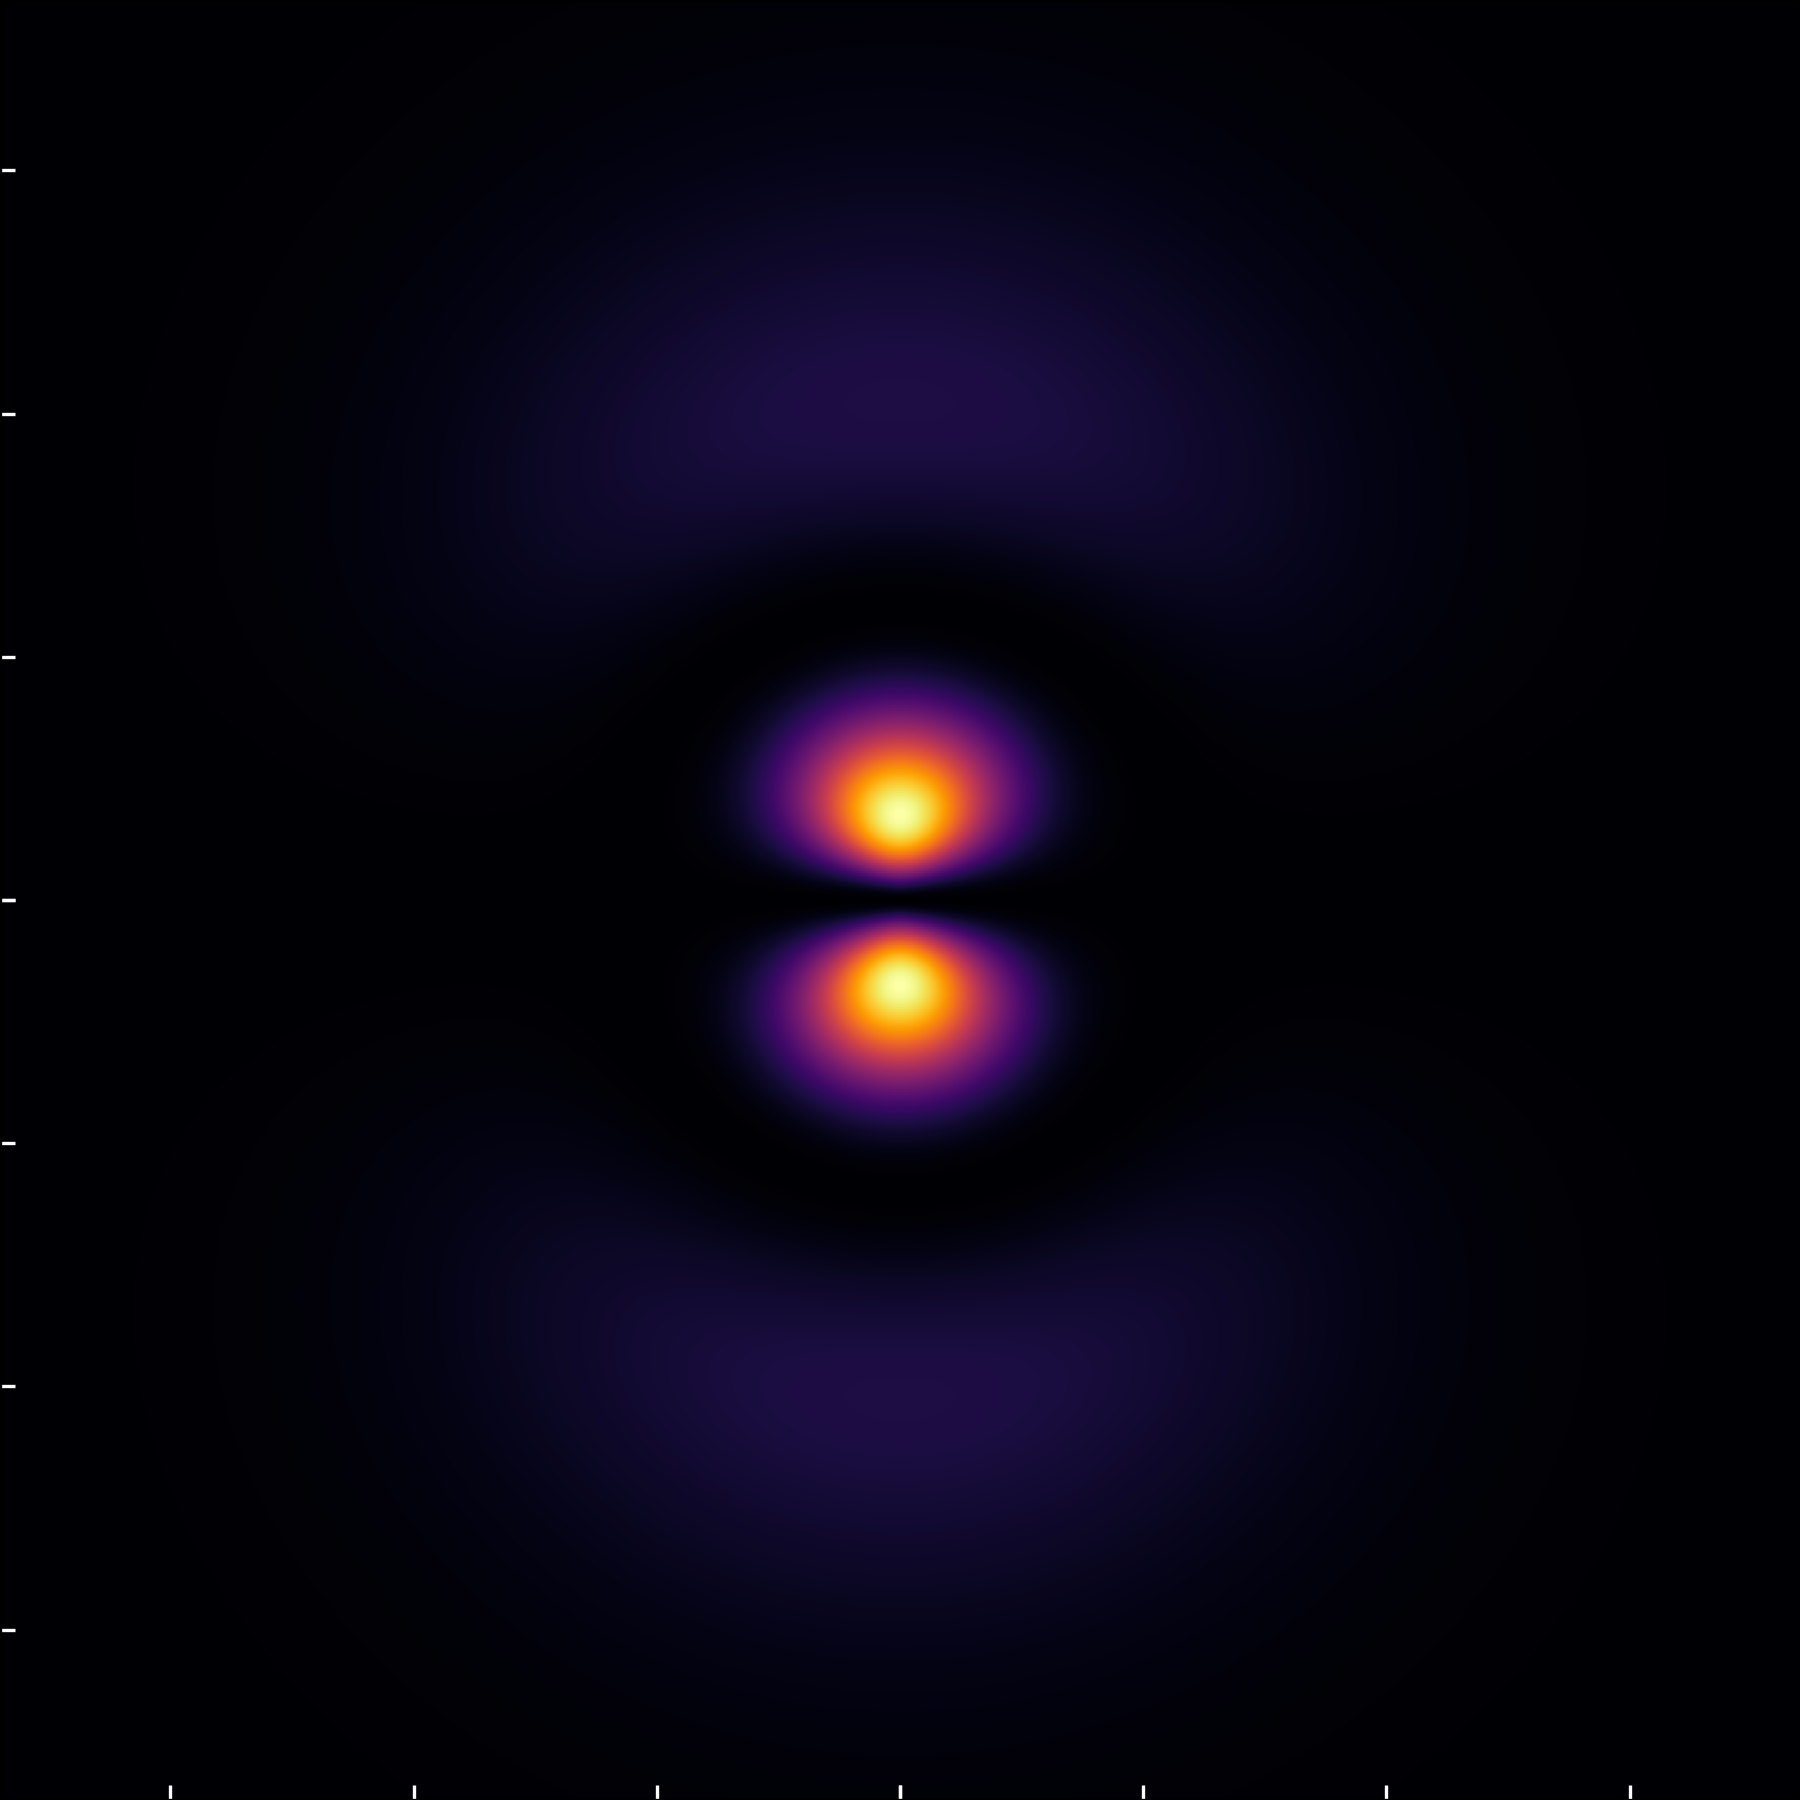
The (3,1,0) state, with \ell=1, demonstrates a nodal circle segmenting the wavefunction, with an additional radial node evident for n=3 and \ell=1, further clarified under the modified scale.
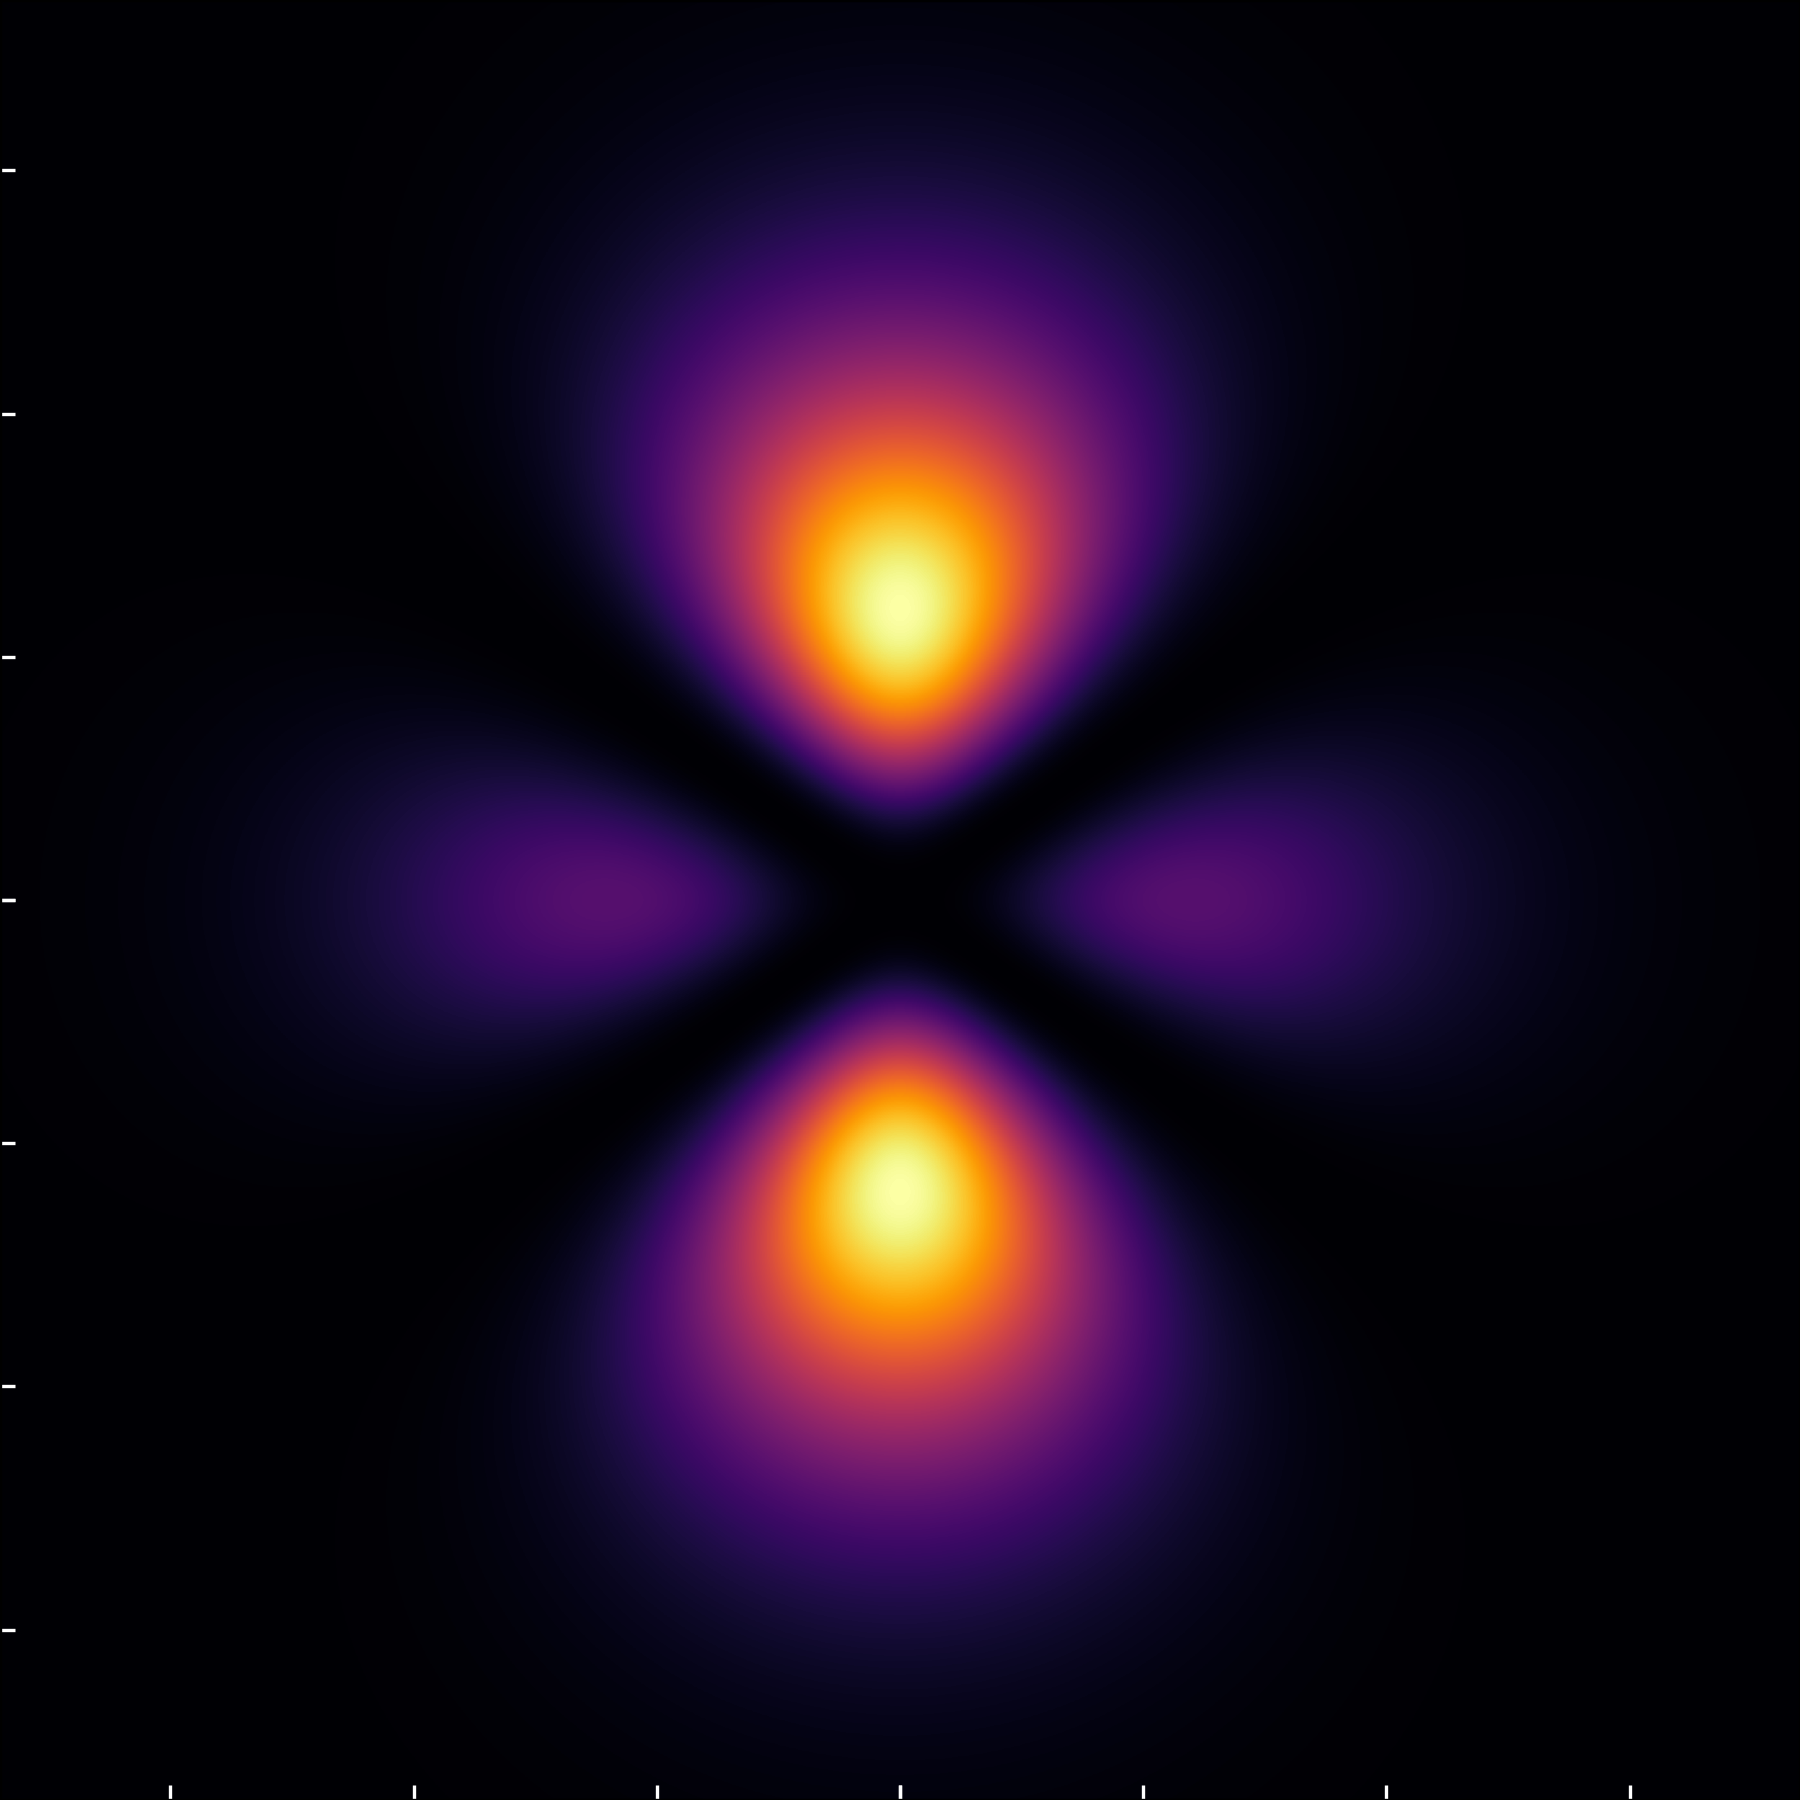
The (3,2,0) states offer a visual departure, where the \ell=2, m=0 state lacks nodal circles through the poles but features two nodal circles compressing the orbital in orthogonal directions, a characteristic underscored by angular rather than radial zeroes.
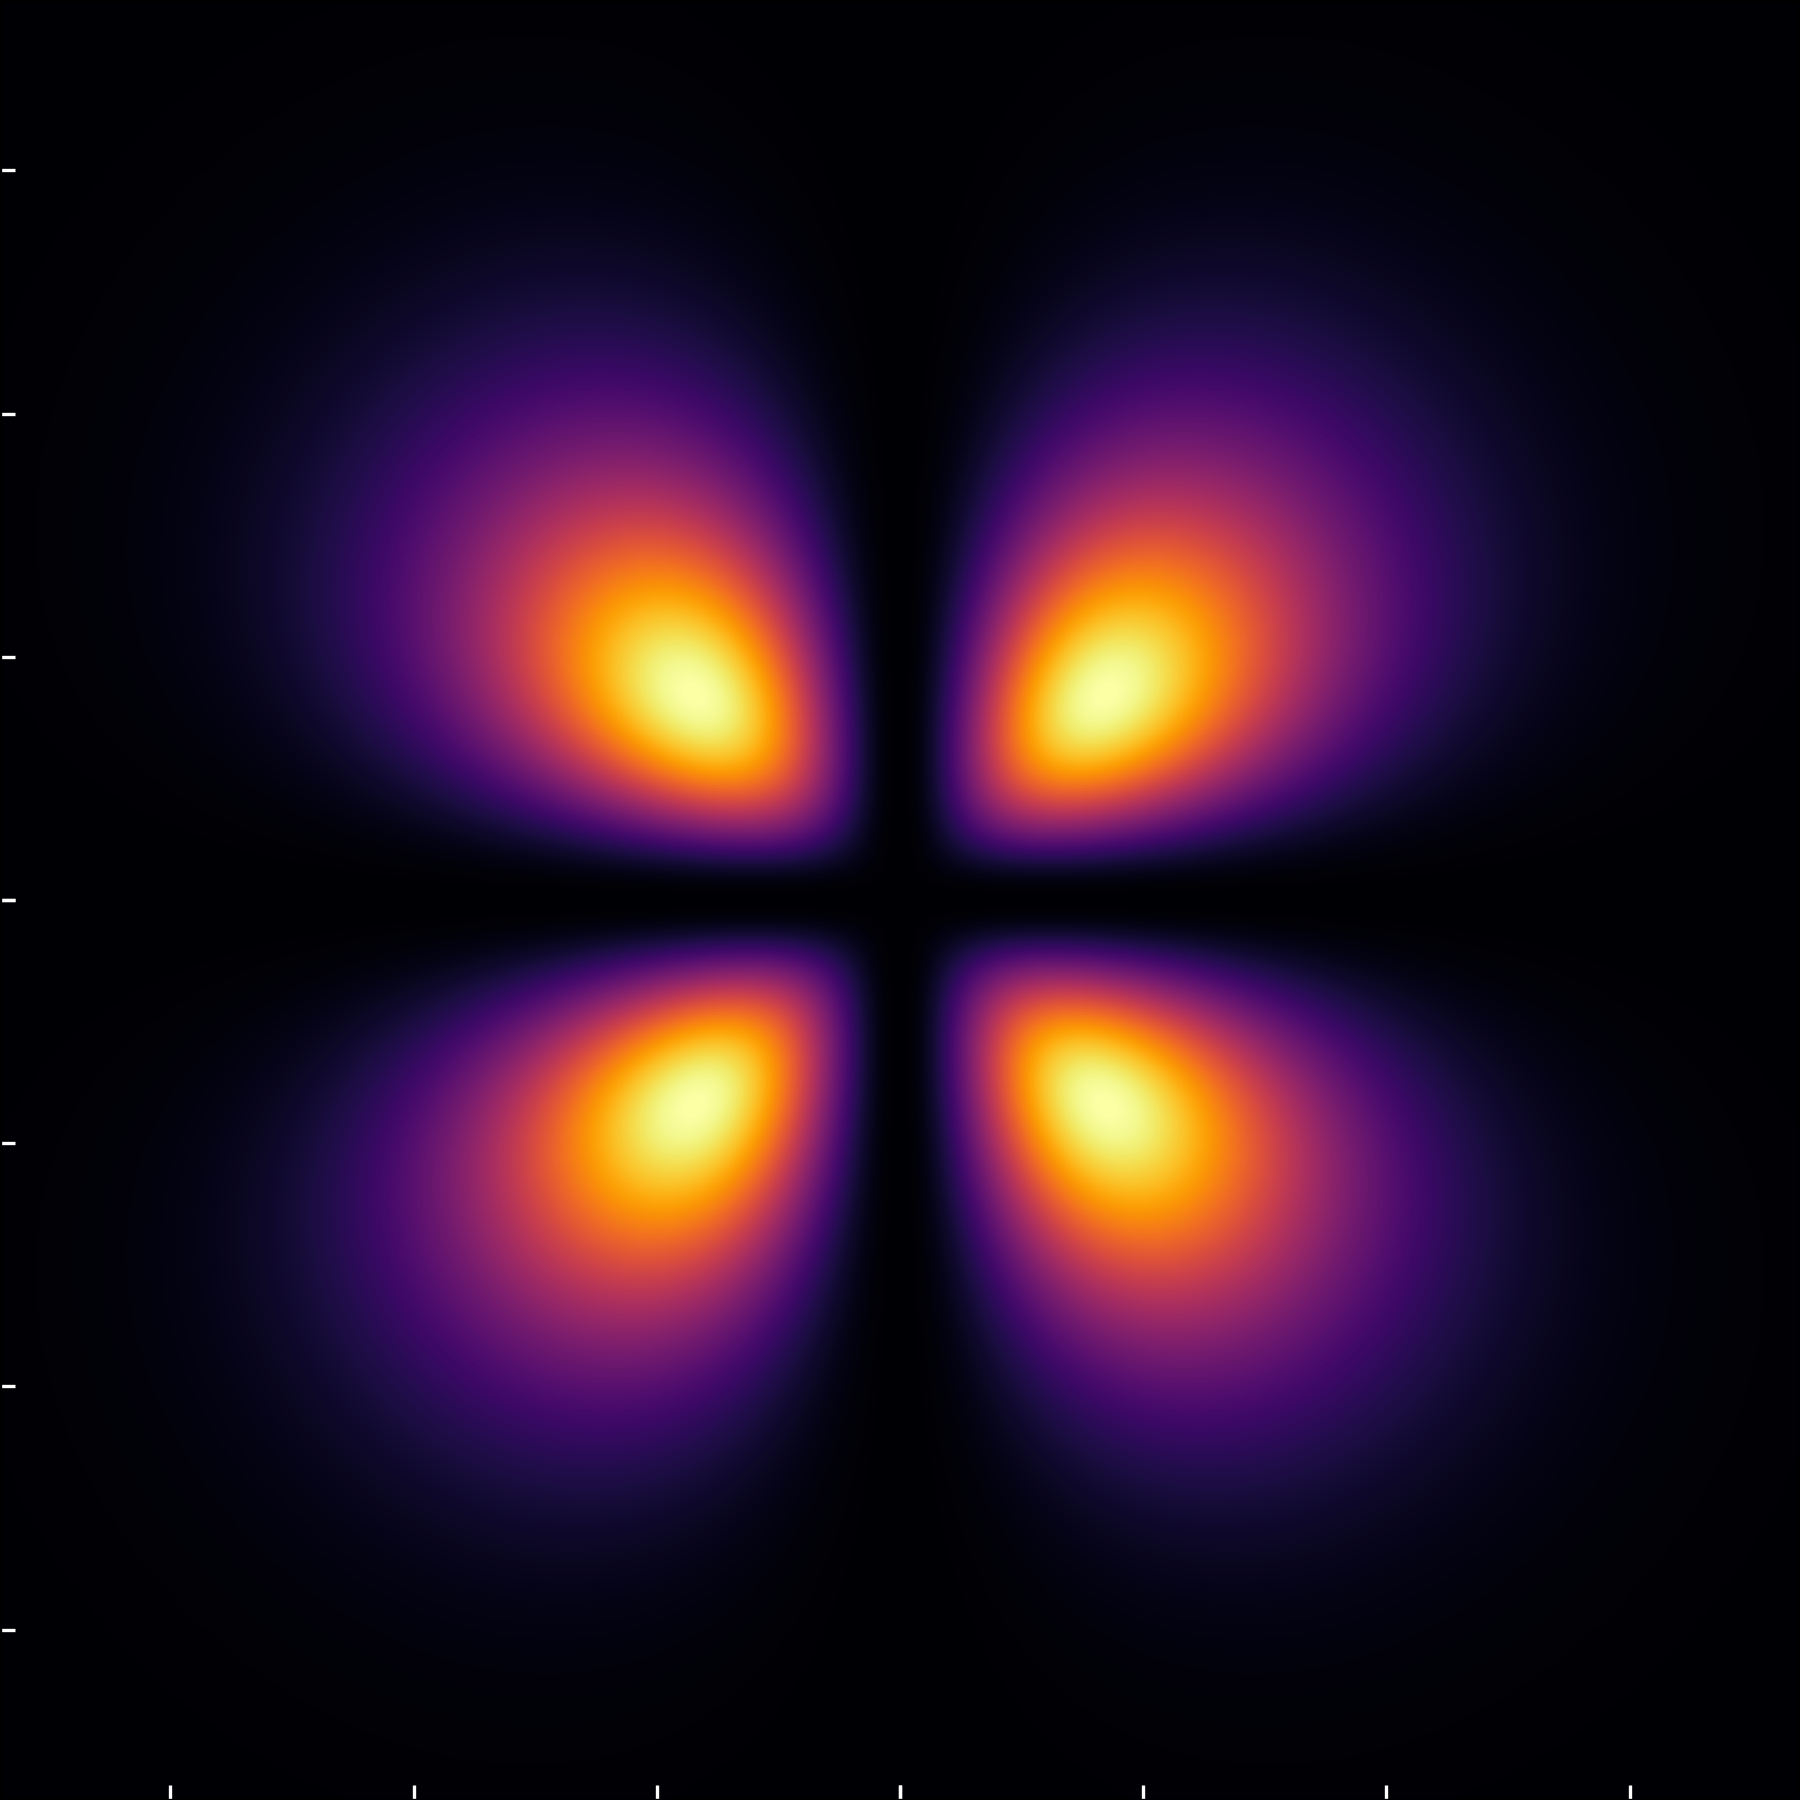
The (3,2,1) configuration with \ell=2 showcases two nodal circles—one through the poles and another encircling the equator—without necessitating additional radial nodes due to the angular zeroes.